This piece is an adaption of a report of the same name available for download here.
Asian Americans are not new to the legal profession. But as we were reminded in 2015 when the California Supreme Court granted posthumous bar membership to a Chinese applicant denied admission in 1890, Asian Americans long faced exclusion from the legal profession. They were subjects of the law, but not its architects or practitioners. Today, Asian Americans make up a significant number in law schools and throughout the legal profession. Within the span of a generation, Asian Americans have become a visible presence in all sectors; they work as big firm lawyers, small firm or solo practitioners, government attorneys, corporate counsel, prosecutors, public defenders, judges, and more. The participation of Asian Americans in the legal profession has reached levels unthinkable just 30 years ago.
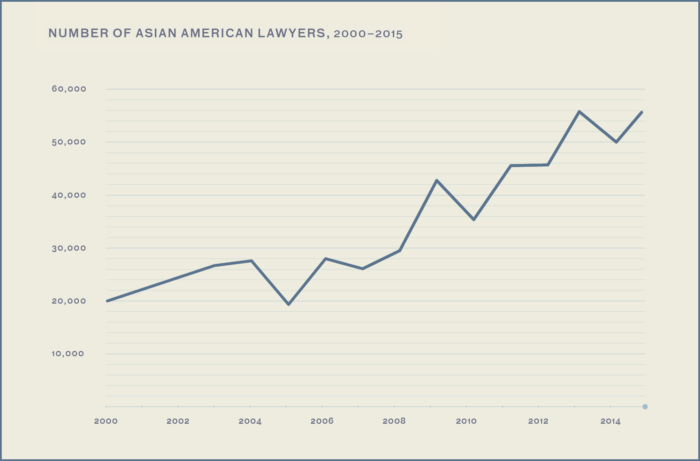
Since 2000, the number of Asian American lawyers has grown from 20,000 to 53,000 today, comprising nearly 5 percent of all lawyers nationwide.
In this issue of The Practice, we consider the progress that has been made over those 30 years, take stock of the challenges that still lie ahead, and present a more nuanced understanding of the experiences of Asian Americans in the law. This lead article features our own empirical research on how Asian Americans are situated in the legal profession. As we detail below, our study looks at a wide range of issues, including law school choices, clerkship rates, employment practice areas, law firm attrition rates, and career satisfaction. In a related supporting article, “Portrait Vignettes,” The Practice also explores the experiences of Asian American lawyers through a series of “portraits”—short narratives following different Asian American lawyers as they navigate their own careers in the legal profession. In a second article, “Incidental Racialization,” sociologist Yung-Yi Diana Pan of Brooklyn College shines a light on the socialization of Asian American students in U.S. law schools based on empirical research recently published in a book of the same title, Incidental Racialization: Performative Assimilation in Law School (Temple University Press 2017). Finally, in this issue’s Speaker’s Corner, Justice Goodwin Liu discusses the experiences of Asian Americans across professions in an interview with surgeon Sandra L. Wong of the Geisel School of Medicine at Dartmouth. Taken as a whole, this issue of The Practice offers perspective on what Asian American participation in the legal profession looks like today, how we got here, and where we might expect to go next.
The Takeaway
Since 2000, the number of Asian American lawyers has grown from 20,000 to 53,000 today, comprising nearly 5 percent of all lawyers nationwide. Through wide-ranging data analysis, focus groups, and a national survey, we have assembled a comprehensive portrait documenting the rise of Asian Americans in the law, their distribution across practice settings, and the challenges they face in advancing to the top ranks of the profession. Our key findings include the following:
- Over the past three decades, the number of Asian Americans in law school has quadrupled to roughly 8,000, now comprising nearly 7 percent of total enrollment— the largest increase of any racial or ethnic group.
- But since 2009, Asian American first-year enrollment has fallen by 43 percent—the largest decline of any racial or ethnic group. The number of Asian Americans who entered law school in 2016 was the lowest in more than 20 years.
- After law school, Asian Americans are more likely than other racial or ethnic groups to work in law firms or business settings, and they are least likely to work in government. Few Asian Americans report that gaining a pathway into government or politics was a primary reason they attended law school.
- Although Asian Americans comprised 10.3 percent of graduates of top-30 law schools in 2015, they comprised only 6.5 percent of federal judicial law clerks.
- For nearly two decades, Asian Americans have been the largest minority group in major law firms. But they have the highest attrition rates and the lowest ratio of partners to associates among all groups.
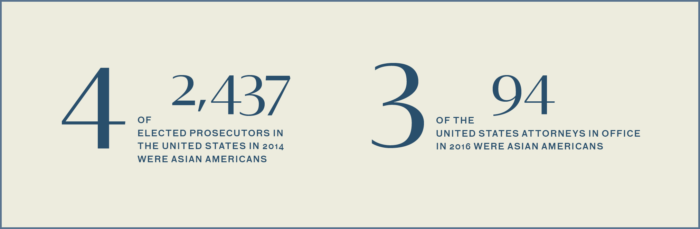
- Although a significant number of Asian Americans serve as line prosecutors and government attorneys in some agencies and jurisdictions, their numbers dwindle at the supervisory level. In 2016, there were only three Asian Americans serving as United States Attorneys, and in 2014, there were only four Asian Americans serving as elected district attorneys nationwide.
- Despite recent progress, only 25 Asian Americans served as active Article III judges in 2016, comprising 3 percent of the federal judiciary. Asian Americans comprised 2 percent of state judges in 2014.
- Many Asian American attorneys report experiencing inadequate access to mentors and contacts as a primary barrier to career advancement.
- Many Asian American attorneys report implicit bias and stereotyped perceptions as obstacles to promotion and advancement. Among Asian American attorneys, women are more likely than men to report experiencing discrimination on the basis of race.
- Asian American attorneys may experience mental health challenges at a higher rate than the legal profession as a whole.
Overall, Asian Americans have penetrated virtually every sector of the legal profession, but they are significantly underrepresented in the leadership ranks of law firms, government, and academia. Our study provides a descriptive account of this central finding, laying the groundwork for future exploration of causal mechanisms and potential solutions. The barriers to career advancement facing Asian Americans lawyers are often subtle and not explicit, but they are nonetheless real. Asian Americans have a firm foot in the door of the legal profession; the question now is how wide the door will swing open.
The Portrait Project
Over the past three decades, Asian Americans have dramatically increased their presence in the legal profession. In 1983, there were around 2,000 Asian American and Pacific Islander students enrolled across all ABA-accredited law schools, comprising less than 2 percent of total enrollment. By the mid-2000s, Asian American and Pacific Islander enrollment had increased more than five-fold to over 11,000 students. The number of Asian American lawyers has more than doubled since the year 2000. There are now over 53,000 lawyers who are Asian American, comprising 4.7 percent of all lawyers in America. The number of Asian American lawyers will keep growing for at least another decade as the size of the cohorts coming into the profession continues to exceed the size of the cohorts aging out.
Although the American Bar Association and other groups regularly publish data on diversity in the legal profession, there has not yet been a comprehensive study of the career paths of Asian American law students and lawyers. Perhaps the closest effort is the wide-ranging longitudinal study, After the JD, which examines the career paths of a national cohort of nearly 4,000 lawyers, including more than 200 Asian Americans. Building on that study and others, this project—A Portrait of Asian Americans in the Law (the Portrait Project)—is an initial effort toward a systematic understanding of how Asian Americans are situated in the legal profession. We aim to describe the rise of Asian Americans in the law as well as the incentives and choices that influence their career paths. This information is intended to provide an empirical grounding for broader conversation within and beyond the Asian American community about the unique challenges and opportunities Asian Americans face in the legal profession and possible directions for reform. We address five broad sets of questions:
- How are Asian Americans distributed across law schools and the legal profession? In what sectors and positions are they overrepresented or underrepresented?
- What factors influence how Asian Americans are distributed in the legal profession? What motivations or aspirations do Asian Americans have when they decide to attend law school? What incentives and obstacles—familial, societal, financial, or professional—affect the career decisions of Asian American law students and lawyers? What stereotypes do they face in navigating the legal profession? In what ways do they seek to counter or assimilate to those stereotypes?
- Are Asian American lawyers satisfied with their careers? With what aspects of their careers are they most satisfied? Least satisfied? Does their career satisfaction vary over the course of their career?
- To what extent have Asian Americans achieved positions of leadership that enable them not only to practice and implement the law, but also to shape the law and the legal profession?
- To what extent do Asian American lawyers experience mental health challenges? How do they compare on this dimension to the profession as a whole? How often do Asian American lawyers seek treatment?
Study Design
Our study has three main components:
1. We canvassed and synthesized a broad array of existing information on Asian Americans in the law as well as literature on diversity in law schools and the legal profession. We also collected data through specific requests to government agencies and other organizations. This wide-ranging effort enabled us to assemble comprehensive statistics on Asian Americans in law schools and various sectors of the legal profession.
2. We conducted 12 focus groups with 77 Asian American attorneys at the November 2015 convention of the National Asian Pacific American Bar Association (NAPABA) in New Orleans. We organized the focus groups by practice setting (large law firms, mid-size law firms, small firms, solo practitioners, nonprofit, government, corporate counsel, judges, prosecutors/public defenders, and students), with 4 to 12 participants in each group. The focus groups, each lasting one hour, used a standard script examining motivations for pursuing a legal career, experiences in law school, influences affecting career choices, obstacles to professional advancement, perceptions of discrimination, and the role of Asian American identity and affinity groups. Through the focus groups, we gained qualitative insights that informed our statistical findings and guided our construction of a survey instrument.
3. We disseminated a 68-item survey (Portrait Project Survey or “PPS”) through NAPABA and affiliated networks to collect information from a larger population of Asian American lawyers. From each respondent, the survey gathered data on basic demographics, political participation, law school experiences, career choices and experiences in the legal profession, and future aspirations. Throughout this report, we have included quotes from both our focus group sessions and responses to our survey’s open-ended questions. We received completed surveys from 606 respondents comprising:
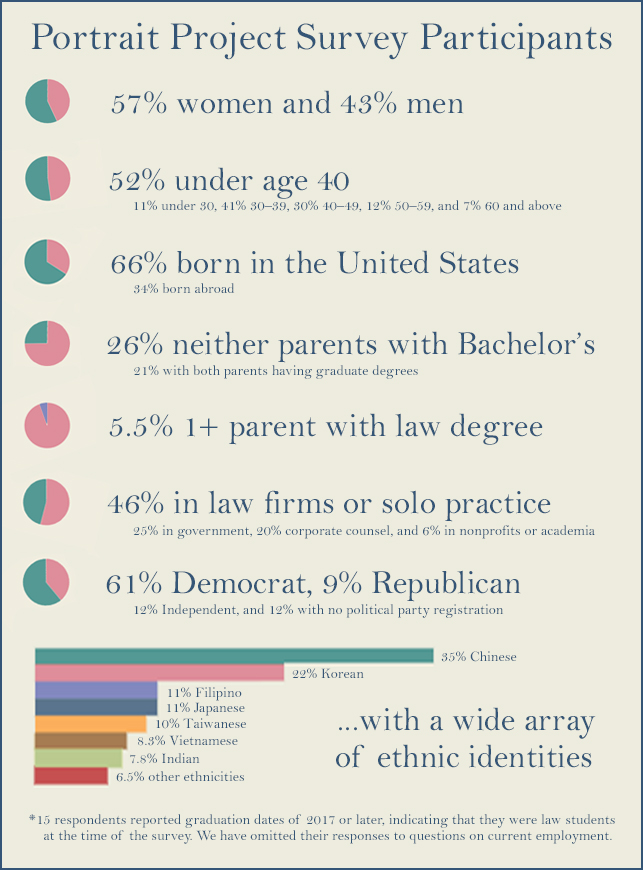
Because there are no population-wide data on many of the characteristics above, it is unclear whether the survey respondents comprise a representative sample of all Asian American lawyers. But it is significant that our sample comprises roughly 1 percent of Asian American lawyers nationwide and generally reflects Asian American enrollment trends over the past four decades. Given the size of our sample, we are able to make valid comparisons among survey respondents on a variety of dimensions. Our sample is likely skewed in one obvious way: Because we administered our survey through NAPABA and affiliated networks, and because respondents filled out the survey on a voluntary basis, it is likely that the respondents have a stronger interest in Asian American identity or more strongly value the opportunities afforded by Asian American affinity groups than the overall population of Asian American lawyers.
A word of note: we use the term “Asian American” and “Asian” in accordance with their usage by cited sources. The terms are not necessarily interchangeable and may reflect variation in the included subgroups. For example, the term “Asian” may include foreign nationals, and “Asian American” sometimes but not always includes Pacific Islanders. We also use the terms “Hispanic” and “Latino,” as well as “Black” and “African American,” in accordance with their usage by cited sources.
Asian Americans in Law School: When, where, and why
Over the past three decades, the enrollment of Asian Americans in law school has increased more than the enrollment of any other racial or ethnic group. From a mere 1,962 students in 1983, Asian American enrollment rose to a peak of 11,327 in 2009 before declining to 8,975 in 2013. Whereas African American enrollment nearly doubled and Hispanic enrollment tripled from 1983 to 2013, Asian American enrollment more than quadrupled over that time. From 2003 to 2010, Asian Americans were the largest minority group attending law school, comprising 7 percent to 8 percent of total enrollment.
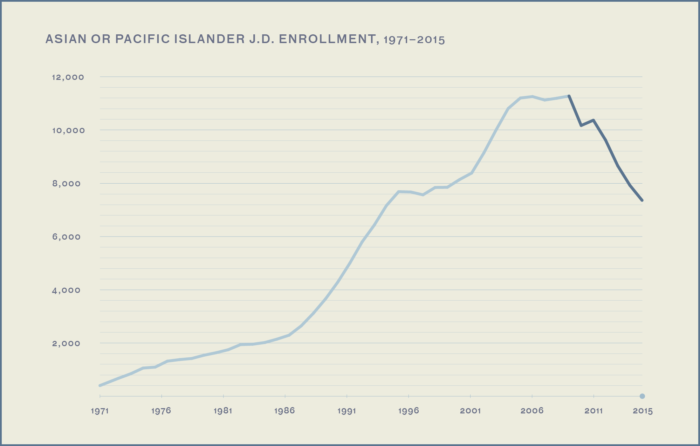
But since 2009, the enrollment of Asian Americans has declined more than the enrollment of any other racial or ethnic group, and the number of Asian Americans who entered law school in 2016 was the lowest in more than 20 years. From 2009 to 2016, whereas total first-year enrollment declined by 28 percent, Asian American first-year enrollment declined by 43 percent, from 3,987 to 2,263. The Asian American share of first-year enrollment in 2016, at 6.1 percent, was the lowest since 1997. Meanwhile, since 2009, first-year enrollment has declined by 34 percent among whites and by 14 percent among African Americans, while it has increased by 29 percent among Hispanics.
Over the past three decades, the enrollment of Asian Americans in law school has increased more than the enrollment of any other racial or ethnic group.
We found no simple relationship between the extent of Asian American enrollment decline and law school tier. It is possible that the 2008–2009 recession and instability in the legal employment market, together with the relative attractiveness of other professions, have disproportionately deterred qualified Asian Americans from pursuing law school. One recent study suggests that some schools are combating enrollment declines by recruiting more African American and Hispanic students, which may help account for the decline of Asian American enrollment relative to other minority enrollment (but does not explain why Asian American enrollment has declined more steeply than white enrollment). Notably, the decline in Asian American enrollment since 2009 has not yet reached a plateau. This recent trendline deserves attention and further research.
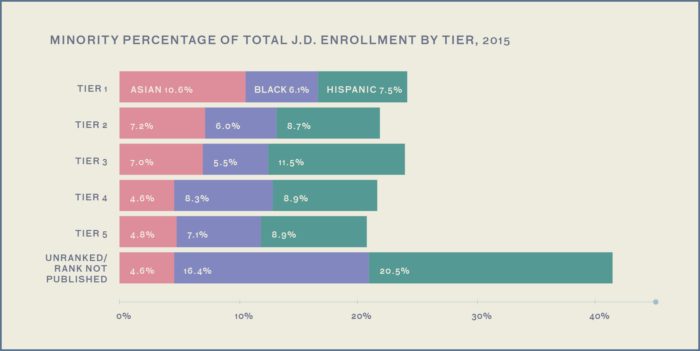
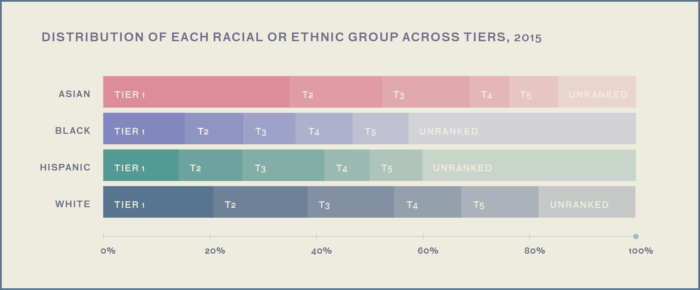
Asian Americans are disproportionately enrolled in higher-ranked schools. In 2015, 34 percent of Asian American law students were enrolled in the top quintile of schools (the top 30 schools) ranked by U.S. News & World Report, compared to 21 percent of white students, 15 percent of African American students, and 14 percent of Hispanic students. More than half of Asian American law students in 2015 attended a law school in the top two quintiles.
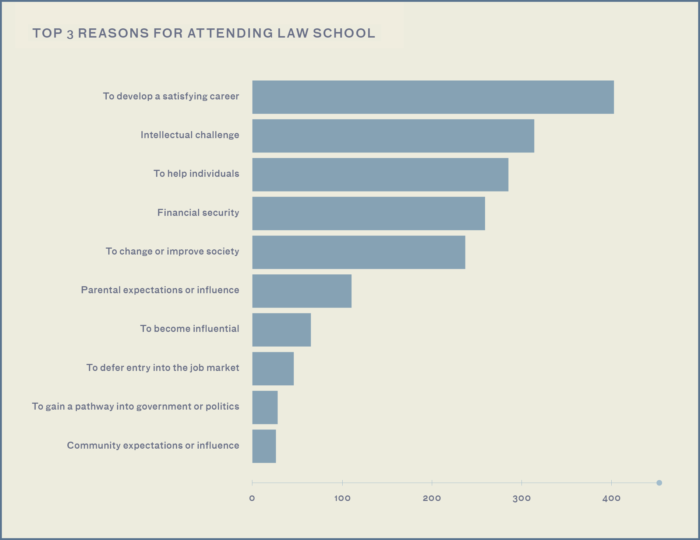
Very few Asian Americans report that one of their primary motivations for attending law school was to become influential or to gain a pathway into government or politics. The motivations for attending law school that PPS respondents ranked as most significant were to develop a satisfying career, to challenge themselves intellectually, and to help individuals. Only 11 percent of PPS respondents indicated that one of their top three motivations for attending law school was to become influential; only 4.7 percent indicated that one of their top three motivations was to gain a pathway into government or politics. This is consistent with After the JD’s findings that Asians were less likely than other groups to indicate that an important reason they attended law school was to become influential and that Asians were far less likely than other groups to have considered politics as an alternative to a legal career. Only 14 percent of Asian respondents in the After the JD survey considered politics as an alternative career to law, compared to 34 percent of whites, 32 percent of blacks, and 27 percent of Hispanics.
Realities after Law School: Clerkships and transition to practice
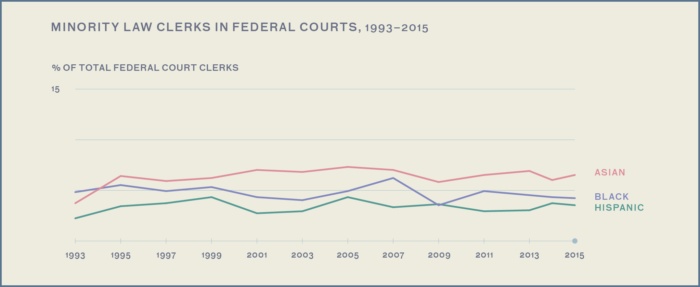
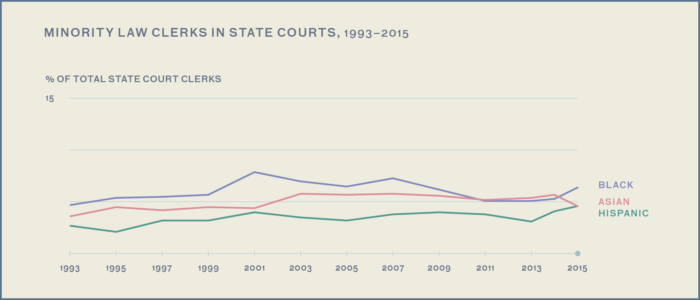
The percentage of Asian Americans serving as judicial clerks has been stagnant over the past two decades. In 1995, Asian Americans comprised 6.4 percent of federal clerks and 4.5 percent of state clerks. Twenty years later, that percentage is only up 0.1 percent for both federal and state clerks. Other minority groups have fared little better. African Americans made up 5.5 percent of federal clerks and 5.4 percent of state clerks in 1995 compared to 4.2 percent of federal clerks and 6.4 percent of state clerks in 2015. Hispanics comprised 3.4 percent of federal clerks and 2.1 percent of state clerks in 1995 compared to 3.5 percent of federal clerks and 4.6 percent of state clerks in 2015.
Asian Americans are disproportionately enrolled in higher-ranked schools.
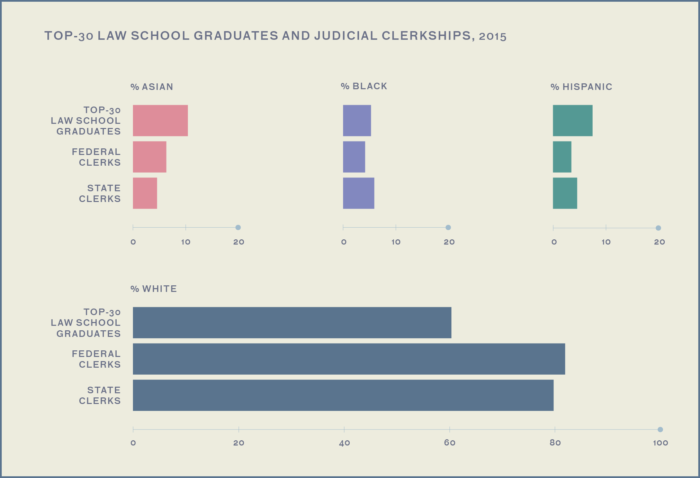
The share of judicial law clerks who are Asian American is markedly lower than the share of graduates from top schools who are Asian American. In 2015, Asian Americans comprised 10.3 percent of graduates from the top 30 schools ranked in the U.S. News & World Report. However, they accounted for only 6.5 percent of federal law clerks and 4.6 percent of state law clerks. The shares of federal clerkships going to African Americans as well as the shares of federal and state clerkships going to Hispanics likewise trail their respective shares among top-30 law school graduates. By contrast, whereas 58.2 percent of students from top-30 schools were white, they obtained 82.4 percent of all federal clerkships and 80.2 percent of all state clerkships.
The likelihood of clerking is positively associated with having more than two mentors in law school. In our survey, 30 percent of respondents who had more than two mentors in law school obtained a clerkship, compared to 19 percent of respondents with one or two mentors, 21 percent of respondents who sought mentors but had none, and 15 percent of respondents who did not seek or have mentors. Whereas 12 percent of respondents with more than two mentors obtained a federal appellate clerkship, the same was true of 4.6 percent of respondents with one or two mentors, 2.4 percent of respondents who sought mentors but had none, and 3.0 percent of respondents who did not seek or have mentors.
“I wish I could have found one or two people who would commit to mentoring me through law school, especially since there are no lawyers in my family or in my family’s immediate circle,” reports one respondent. “I would have probably made much different choices with my career in the beginning had I known more about the industry.”
It is not clear from these data whether mentoring increases the likelihood of obtaining a clerkship or whether students who seek mentors, successfully or not, are better clerkship candidates. Both may be true. We note that although respondents who had one or two mentors do not differ much in their likelihood of clerking compared to those who had no mentors, the substantially higher likelihood of clerking among those with more than two mentors is suggestive. It is possible that students who find more than two mentors are especially strong clerkship candidates, and it is also possible that a multiplicity of mentors increases the likelihood of obtaining a clerkship. More research is needed to distinguish these hypotheses and their relative influence on outcomes.
“My most important mentor was one of my law school professors,” said a respondent. “She taught me important research and writing skills and helped me develop my advocacy skills. She also wrote me letters of recommendation for my prior internships and my current job. She was, and continues to be, my biggest supporter, mentor and friend.”
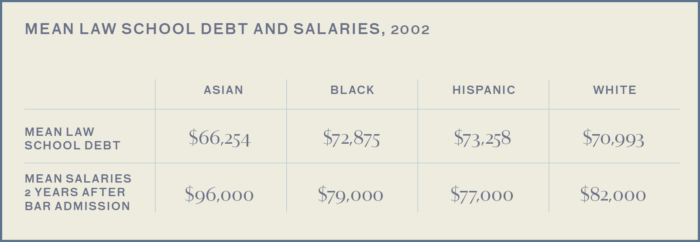
Compared to other groups, Asians graduate from law school with the lowest level of debt and the highest average salaries. The After the JD study found that the average law school debt for Asians was $66,254, compared to $70,993 for whites, $72,875 for Blacks, and $73,258 for Hispanics. Fourteen percent of Asians graduated with no debt, compared to 19 percent of whites, 6 percent of Blacks, and 5 percent of Hispanics. Two years after bar admission, the mean salary was $96,000 for Asians, compared to $82,000 for whites, $79,000 for Blacks, and $77,000 for Hispanics and Native Americans.
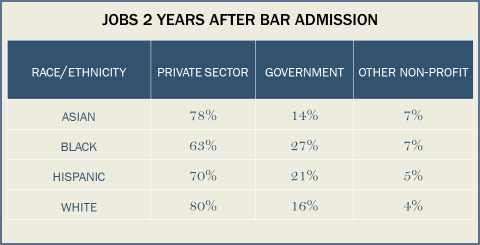
In the initial years after bar admission, Asians are more likely than other groups, except whites, to work in private law firms or other business settings, and they are the least likely to work in government. In the After the JD sample, 70 percent of Asians worked in law firms or business settings two years after bar admission, compared to 72 percent of whites, 52 percent of Blacks, and 58 percent of Hispanics. By contrast, 14 percent of Asians worked in government, compared to 16 percent of whites, 27 percent of Blacks, and 21 percent of Hispanics.
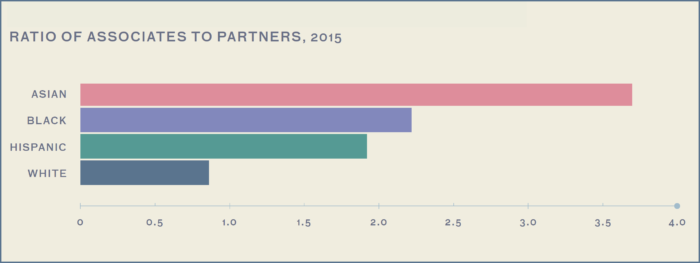
Asian Americans have the highest ratio of associates to partners of any racial or ethnic group, and this has been true for more than a decade.
In those initial years, Asians report the lowest level of satisfaction with their decision to become a lawyer. According to After the JD, Asian American respondents averaged about a 3.8 out of 5 on career satisfaction compared to Hispanic respondents, who averaged 3.9 out of 5, and black respondents, who had the highest satisfaction scores and averaged 4.3 out of 5. After the JD reports that Asians were more likely than all other groups to report a desire for more or better training, more or better mentoring, greater opportunity to shape decisions, and less pressure to bill.
Asian Americans in Law Firms: The narrow funnel to partnership
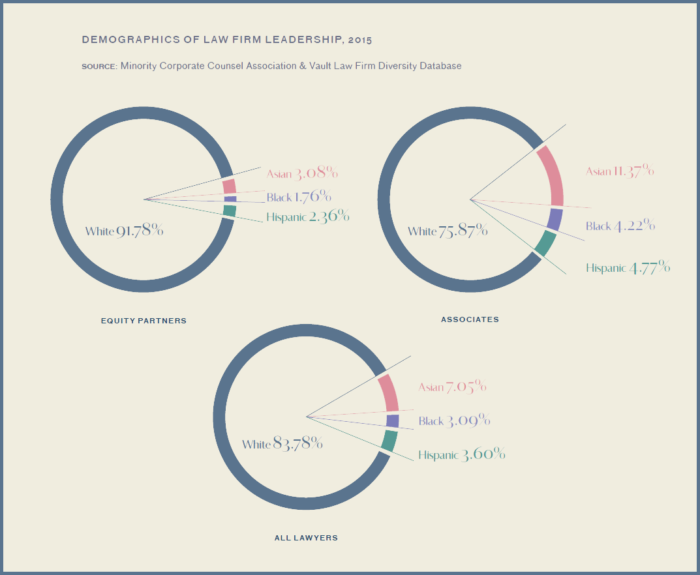
For nearly 20 years, Asian Americans have been the largest minority group at major law firms. In the National Association for Law Placement’s 2016 report on major U.S. law firms, Asians comprised 7.0 percent of attorneys, whereas Hispanics comprised 3.3 percent and African Americans comprised 2.9 percent. Law360’s survey of over 300 firms found that in 2015, Asian Americans comprised 6.5 percent of U.S.-based attorneys, whereas Hispanics comprised 3.4 percent and African Americans comprised 2.9 percent. A 2015 survey of 225 law firms by Vault and the Minority Corporate Counsel Association (Vault/MCCA) reported that Asian Americans comprised 11.4 percent of associates and 13.8 percent of summer associates, African Americans or Blacks comprised 4.22 percent of associates and 6.97 percent of summer associates, and Hispanics or Latinos comprised 4.77 percent of associates and 5.47 percent of summer associates.
Compared to their numbers within the overall law firm population, Asian Americans are less well represented than other groups at the management level.
Asian Americans have the highest ratio of associates to partners of any racial or ethnic group, and this has been true for more than a decade. In 2015, the ratio of associates to partners in the 225 firms surveyed by Vault/MCCA was 3.70 for Asian Americans, compared to 2.22 for African Americans or Blacks, 1.92 for Hispanics or Latinos, and 0.86 for whites. Law360’s survey of 289 firms similarly reported that in 2014 the ratio of non-partners to partners was 3.59 for Asian Americans, 2.37 for Blacks, 1.89 for Hispanics, and 0.98 for whites.
We do not address whether these data reflect differences in the age distribution of attorneys belonging to each group. It is possible that the high ratio of associates to partners for Asian Americans is partly a function of how recently this group has entered the legal profession in substantial numbers. At the same time, as discussed below, Asian Americans have high attrition rates in law firms and reported significant obstacles to career advancement in our survey.
Compared to their numbers within the overall law firm population, Asian Americans are less well represented than other groups at the management level. Although Asian Americans comprised 7.05 percent of all attorneys in the Vault/MCCA survey of 2015 data, they held 2.09 percent of seats on executive management committees, 2.32 percent of seats on partner review committees, and 3.78 percent of seats on associate review committees. African Americans, Hispanics, and whites were better represented in these leadership roles relative to their respective numbers in the overall firm population.
While Asian American lawyers make up 7 percent of the overall law firm population, they make up only 3 percent of all equity partners.
Among Asian Americans, although women outnumber men among law firm associates, men outnumber women by almost twofold at the partner level. In the Vault/MCCA survey of 2014 data, 56 percent of Asian American associates were women, while 36 percent of Asian American partners were women. Among Blacks or African Americans, 58 percent of associates were women and 37 percent of partners were women, and among Hispanics or Latinos, 48 percent of associates were women and 30 percent of partners were women. The ratio of men to women at the partner rank is less skewed among minority groups; across all groups, male partners outnumber female partners by more than three to one. But there are signs of change: Among the 104 Asian Americans promoted to partner in the 2014 survey, 58 were women and 46 were men.
The attrition rate for Asian Americans, as for other minority groups, is disproportionately high. Whereas Asian Americans, Blacks or African Americans, and Hispanics or Latinos comprised 6.7 percent, 3.1 percent, and 3.5 percent of all attorneys, respectively, in the Vault/MCCA 2014 survey, they comprised 8.9 percent, 4.9 percent, and 4.3 percent of attorneys, respectively, who left their firms that year. Vault/MCCA’s 2015 survey revealed that 14 percent of Asian American attorneys left their firms that year, compared to 16 percent of Blacks or African Americans, 11 percent of Hispanics or Latinos, and 10 percent of whites/Caucasians. According to After the JD, the number of Asian Americans working in firms with over 100 attorneys declined by 68 percent over the decade from 2 to 12 years after bar admission, compared to a 61 percent decline among Blacks, a 44 percent decline among Hispanics, and a 53 percent decline among whites.
Prosecutors and Public Defenders: Where we are today
In some jurisdictions, significant numbers of Asian Americans serve as line prosecutors.
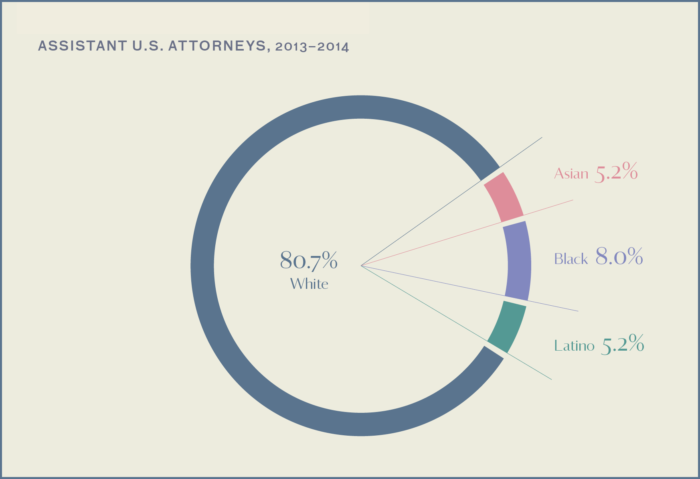
- In 2014, among 5,508 Assistant U.S. Attorneys nationwide, 5.2 percent were Asian, 8.0 percent were Black or African American, and 5.2 percent were Latino.
- In 2015, among 2,996 full-time line prosecutors in county district attorney’s offices throughout California, 12.6 percent were Asian or Pacific Islander, 5.6 percent were Black, and 9.1 percent were Latino. Asians comprise nearly 15 percent of the California population.
- In 2016, among 429 staff attorneys in the Manhattan District Attorney’s office, 8.6 percent were Asian, 10 percent were Black or African American, and 6.1 percent were Hispanic or Latino. Asians comprise nearly 13 percent of the Manhattan population.
- In California, women significantly outnumber men among line prosecutors who are Asian or Pacific Islander. The same is true for Black or African Americans, and the opposite is true for whites. In the Manhattan District Attorney’s office, women significantly outnumber men among line prosecutors for all three of these groups.
But the number of Asian Americans dwindles at the supervisory level and is vanishingly small among United States Attorneys and elected district attorneys.
- Among the 94 United States Attorneys in office in 2016, there were three Asian Americans: one in Hawai‘i, one in Guam and the Northern Mariana Islands, and one in the Southern District of New York.
- In 2015, among the 769 full-time supervisory prosecutors in California, 9.0 percent were Asian American or Pacific Islander, 6.6 percent were Black, and 11 percent were Latino. Among 52 counties composing nearly 98 percent of California’s population, there was only one elected district attorney who is Asian or Pacific Islander.
- In 2016, among the 161 supervising attorneys in the Manhattan District Attorney’s office, 4.3 percent were Asian American, 7.5 percent were Black or African American, and 6.2 percent were Hispanic or Latino.
- A 2014 survey identified only 10 Asian Americans among the 2,437 elected prosecutors in the nation. We independently sought to identify these 10 and, in so doing, found that only four are actually Asian American. By comparison, the survey identified 64 African American and 41 Hispanic elected prosecutors. The vast majority of elected prosecutors in America—95 percent in the survey—are white.
There are no systematic data currently available on the demographics of public defenders. Although the U.S. Department of Justice conducts an ongoing Census of Public Defender Offices, this data collection does not include attorney demographics. As of 2016, the Justice Department was developing a survey instrument to collect information on public defenders nationwide, including demographic data.
Government Attorneys: The funnel problem continues
Over the past decade, Asian Americans have occupied an increasing share of attorney positions in the federal government. According to 2015 data compiled by the U.S. Equal Employment Opportunity Commission, Asians comprised 6.7 percent of attorneys in 68 federal agencies, whereas Blacks comprised 8.3 percent and Hispanics or Latinos 4.8 percent. Men outnumbered women by a ratio of 1.3 to 1 among white attorneys, while women outnumbered men by a ratio of 1.4 to 1 among Asians, by 1.9 to 1 among Blacks, and by 1.1 to 1 among Hispanics or Latinos. In six of the agencies with the largest numbers of attorneys, the share of attorneys who are Asian increased from 4.2 percent in 2005 to 6.4 percent in 2015.
The U.S. Department of Justice, the leading federal agency responsible for setting law enforcement and legal policy priorities, has the largest number of attorneys but a low percentage of Asian Americans compared to other agencies. In 2015, Asian Americans comprised 5.7 percent of attorneys in the U.S. Department of Justice and 5.5 percent of attorneys in the Executive Office of the U.S. Attorneys, compared to 7.5 percent across all other agencies. Among senior level positions in the Justice Department as of 2011, the percentage of Asians was even smaller at 3.1 percent.
The percentage of attorneys who are Asian American dwindles at higher ranks of government. In 2016, Asians made up 9.0 percent of GS-11 federal government attorneys, but only 5.6 percent of GS-15 attorneys (the highest civil service pay grade) and 5.2 percent of non-GS attorneys with annual salaries over $150,000.
Asian American Judges: Growing, but still too few
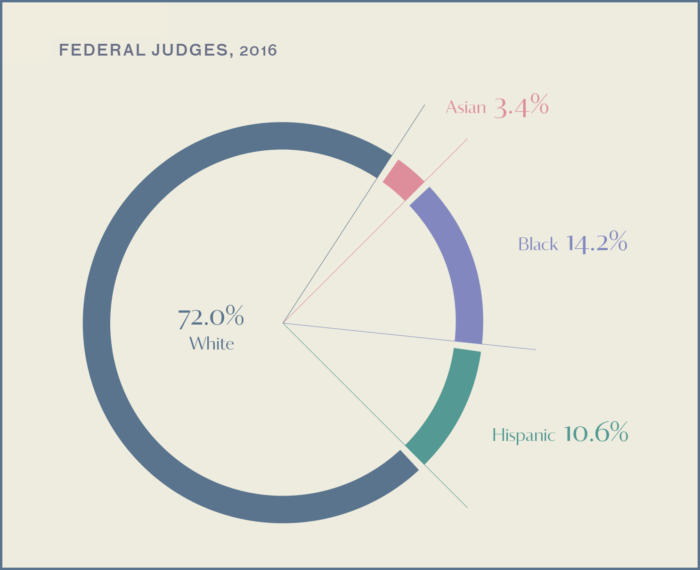
The number of Asian Americans on the federal bench has increased over the past decade but remains small. As of 2016, only 37 Asian Americans had ever served as Article III judges. Among them, 25 served as active judges—19 as federal district judges, five as federal circuit judges, and one as a judge on the U.S. Court of International Trade—comprising 3.4 percent of the 744 authorized active federal judges, compared to 536 (72 percent) for whites, 106 (14.2 percent) for African Americans, and 79 (10.6 percent) for Hispanics. In 2016, there were 47 Asians serving as federal administrative law judges, less than 3 percent of the total.
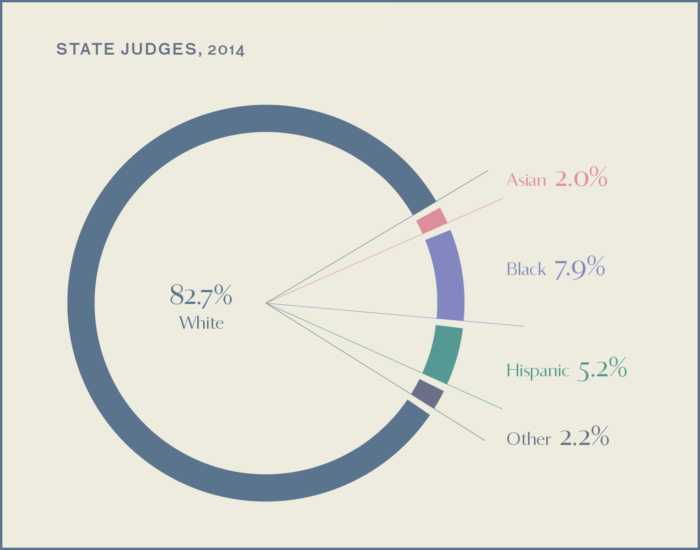
Asian Americans are less well represented among state judges than among federal judges. In 2014, Asian Americans made up approximately 2 percent of 10,295 surveyed judges serving on a state appellate court or general jurisdiction trial court, compared to 82.7 percent for white non-Hispanics, 7.9 percent for African-Americans, and 5.2 percent for Hispanics. Forty states did not have a single Asian American judge serving on a state appellate court, and 21 states did not have a single Asian American judge serving on a state appellate court or general jurisdiction trial court. Asian Americans made up less than 1 percent of state appellate or general jurisdiction trial judges in another 12 states, including several with significant Asian American populations (e.g., Illinois, Maryland, New York, and Virginia). Among the 334 state high court judges in the nation, we are aware of 8 Asian Americans.
Hawai‘i and California have the most Asian American judges. Over three-quarters of Hawai‘i’s state judges are Asian American. In 2015, 108 (or 6.5 percent) of California’s 1,674 judges were Asian, 110 (or 6.6 percent) were African American, and 165 (or 9.9 percent) were Hispanic or Latino. In 2014, only 22 (or 1.8 percent) of New York’s 1,250 judges were Asian American.
Legal Academia: Small gains—and smallest at the top
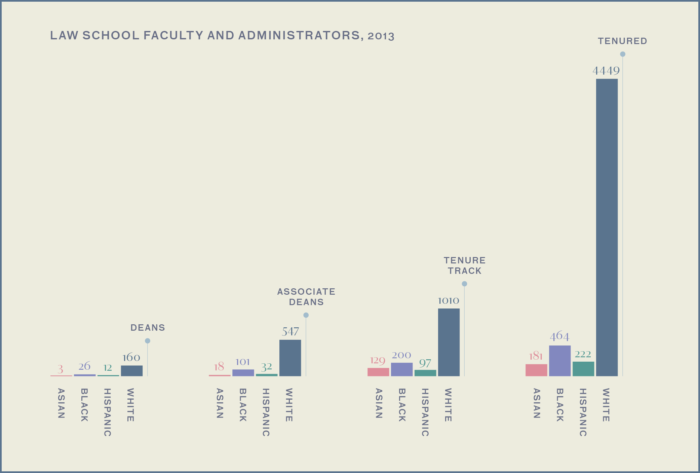
Although Asian Americans have made inroads into legal academia, their numbers remain low. In 2013, among the 8,848 full-time law teachers in the United States, 383 (or 4.3 percent) were Asian American. Among the 6,907 professors in tenured or tenure-track positions, 310 (or 4.5 percent) were Asian American. By comparison, there were only 61 tenure-track or tenured Asian American law professors in 1992.
There are few Asian Americans in the ranks of academic administration and leadership. In 2013, there were three Asian Americans among the 202 law deans in the country and 18 Asian Americans among the 709 associate or vice deans.
Career Satisfaction and Aspirations
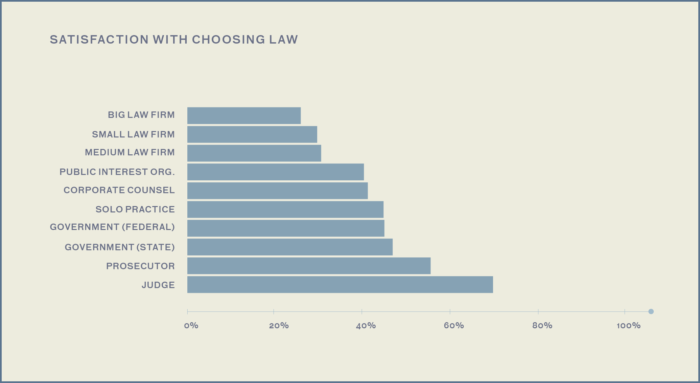
Among PPS respondents, those who work as judges, prosecutors, or government lawyers expressed the greatest satisfaction with their work, while those who work in law firms expressed the least satisfaction. This is consistent with other research finding that lawyers in public service jobs report greater happiness and less alcohol consumption than lawyers in more lucrative private practices.
A majority of PPS respondents (58 percent) indicated they wished to change practice settings, citing as their top reasons a desire for a better match with their interests, higher salary, work-life balance, and geographic location. The lowest-ranked reasons were to participate or gain influence in the political process, prestige, to address the needs of underserved communities, and to advance issues or values important to the respondent. Over two-thirds of PPS respondents who work in law firms, compared to half of those who work in government and 39 percent of those who work as corporate counsel, said they would like to change practice settings.
Among PPS respondents who wished to change practice settings, the settings most often identified as desirable were corporate counsel, the federal government, and nonprofit/public interest organizations. A substantial number of respondents indicated interest in state government, academia, or the judiciary. Few respondents indicated interest in becoming a prosecutor or public defender/legal aid worker.
Obstacles to Professional Advancement
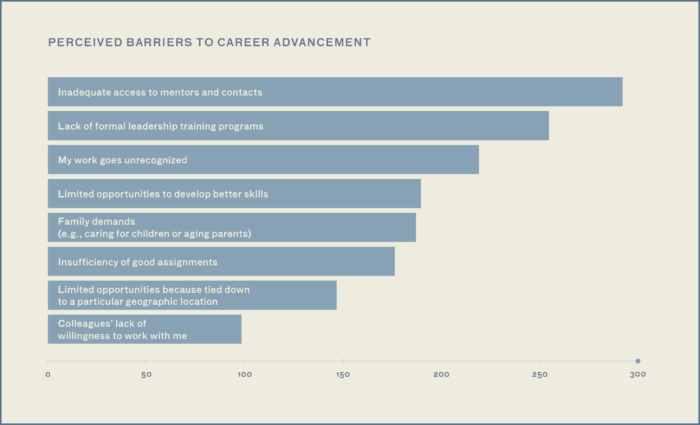
When asked to identify barriers to career advancement, PPS respondents most often cited inadequate access to mentors and contacts, lack of formal leadership training programs, and lack of recognition for their work. Respondents who work in law firms were more likely than other respondents to indicate inadequate access to mentors and contacts, colleagues’ lack of willingness to work together, and insufficiency of good assignments as significant barriers to career advancement.
Women were more likely than men to report experiencing barriers to career advancement. Among PPS respondents, 88 percent of women reported at least one barrier to career advancement, compared to 79 percent of men. The gender disparity was more pronounced for certain obstacles: 37 percent of women, compared to 24 percent of men, cited family demands, including caring for children or aging parents, and 41 percent of women, compared to 31 percent of men, cited lack of recognition for their work. These disparities are statistically significant and persist after controlling for age, ethnicity, immigrant generation, sexual orientation, and law firm employment.
When asked what behaviors they exhibited in the workplace in considering their racial identity and possible discrimination, PPS respondents most commonly reported they “sometimes” sought out association with other Asian Americans for support. On average, PPS respondents reported they did not often try to downplay traits that may bring attention to their Asian identity or avoid association with other Asian Americans. This is unsurprising since we conducted the survey through NAPABA and affiliated networks. Asian Americans who join these organizations are presumably inclined to embrace their racial identity, and they have voluntarily sought to associate with other Asian Americans for support and networking. Women were more likely than men to seek association with other Asian Americans and to seek association with other (non-Asian) identity groups for support.
Respondents in law firms were more likely than other respondents to indicate inadequate access to mentors and contacts, colleagues’ lack of willingness to work together, and insufficiency of good assignments.
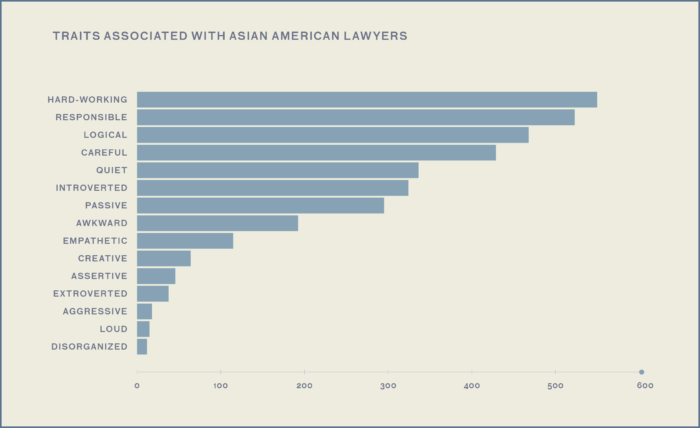
According to PPS respondents, Asian Americans perceive the legal profession as associating them with certain stereotypical traits. Many respondents reported being perceived as hardworking, responsible, logical, careful, quiet, introverted, passive, and awkward. By contrast, few respondents reported being perceived as creative, assertive, extroverted, aggressive, or loud. We found very few statistically significant differences in these reported perceptions across practice settings, which suggests the pervasive nature of these stereotyped perceptions.
The written responses to the survey show how these stereotypes permeate their experiences as lawyers. “Asians work hard and do not say no to their superiors,” one respondent said citing two common stereotypes. “With that, somehow I was the only one staying back to cover the team assignments when the others went out for yoga and wine.” Being a team player is important for all lawyers, but the point is that the wine and yoga are also important in these settings. Many common stereotypes of Asian American lawyers work to exclude them from these social activities and potentially many other opportunities.
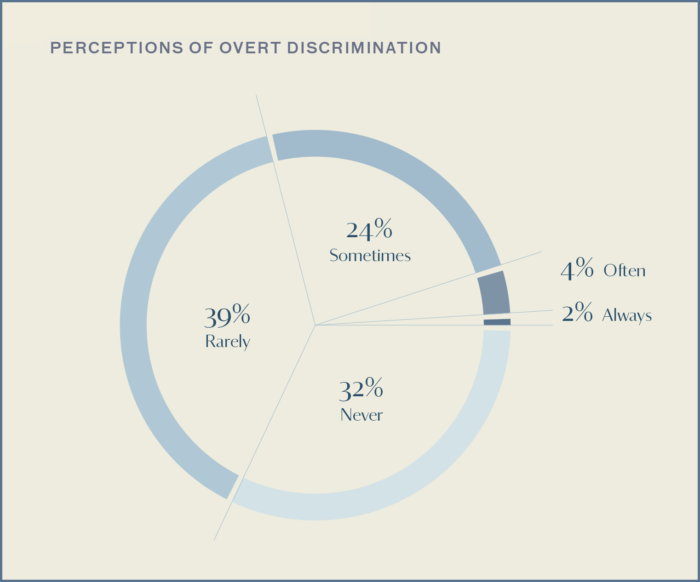
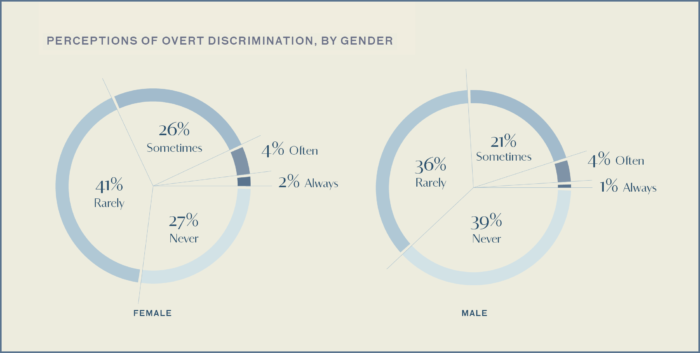
Most PPS respondents did not perceive overt discrimination in the workplace because of their racial identity. Approximately 71 percent of those who answered said they rarely or never perceive overt discrimination in the workplace, 24 percent said they sometimes do, and 6 percent said they often or always do. Government attorneys were less likely to say they perceive overt discrimination than non-government attorneys.
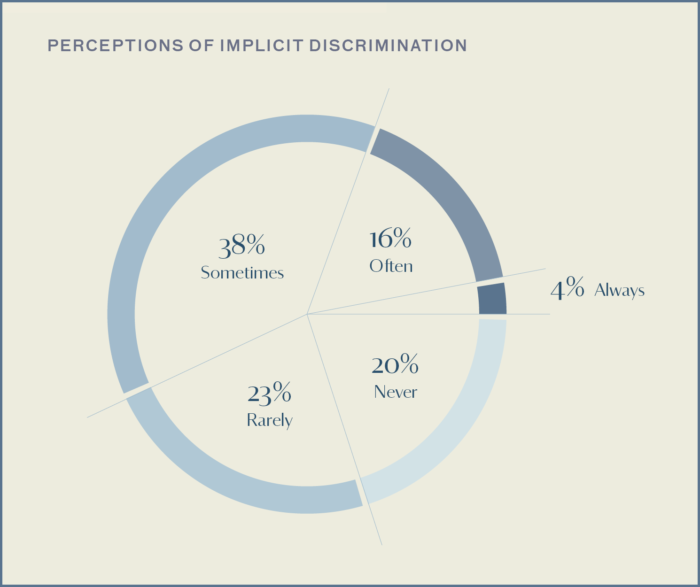
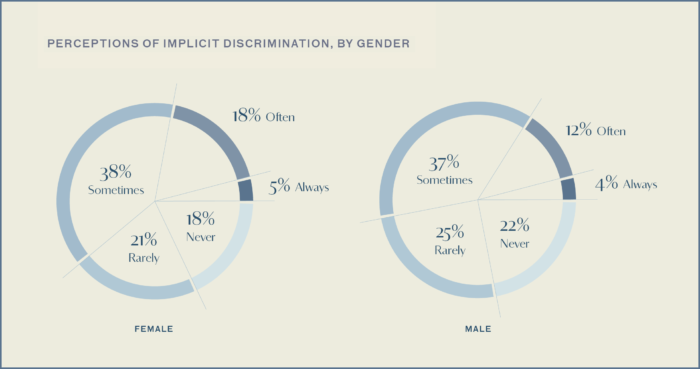
Most PPS respondents do perceive implicit discrimination in the workplace because of their racial identity. Approximately 20 percent of those who answered said they often or always perceive implicit discrimination in the workplace, 38 percent said they sometimes do, and 43 percent said they rarely or never do. This means that at least 80 percent of those surveyed have encountered implicit discrimination at least once. As one respondent put it, “As an APA litigator, I believe that I am not selected for certain assignments (e.g., oral argument) because I am not seen as having enough ‘presence’ to effectively advocate in court.” Added another, “I’m an immigration lawyer. When I go to immigration court, I’m mistaken for the alien. When I go to jail to visit a client, I’m mistaken for their girlfriend.”
Perceptions of discrimination differ by gender. Among PPS respondents who answered the survey questions about perceptions of discrimination, 32 percent of women reported experiencing overt discrimination on the basis of race sometimes, often, or always at the workplace, compared to 26 percent of men, and 61 percent of women reported experiencing implicit discrimination on the basis of race sometimes, often or always at the workplace, compared to 53 percent of men. These disparities are statistically significant and persist after controlling for age, ethnicity, immigrant generation, sexual orientation, and law firm employment. “Being an Asian woman added another layer as men were often more interested in expressing themselves as romantic prospects as opposed to colleagues,” said one respondent.
Mental Health
A substantial minority of PPS respondents reported moderate to severe mental health challenges during their legal careers. Among respondents who answered the question, 36 percent reported moderate to severe anxiety, 22 percent reported moderate to severe insomnia, and 20 percent reported moderate to severe depression. Controlling for other factors, women were more likely than men to experience mental health challenges in law school and during their legal careers.
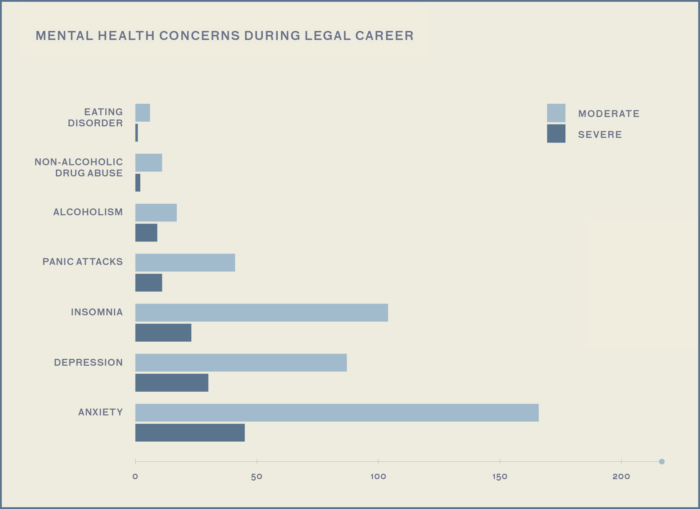
Asian American lawyers may experience mental health challenges at a higher rate than the legal profession as a whole. A recent study of 12,825 American lawyers in the United States found that 61 percent reported anxiety, 46 percent reported depression, and 8 percent reported panic disorder (defined as recurring panic attacks), whereas 72 percent of PPS attorney respondents who answered the question reported anxiety, 52 percent reported depression, and 23 percent reported panic attacks. However, PPS respondents may be less likely to experience alcohol or other substance abuse problems than the general attorney population. Whereas 11 percent of PPS respondents who answered the question reported alcoholism and 4 percent reported other drug abuse at mild, moderate, or severe levels, 23 percent of respondents in the national study reported that their use of alcohol or other substances had been problematic at some point in their lives.
Controlling for other factors, PPS respondents who work in law firms were 41 percent more likely than non-law firm respondents to report moderate or severe anxiety. We found no statistically significant difference between private and public sector respondents on reported anxiety when controlling for law firm employment.
Controlling for other factors, PPS respondents with at least one parent with a law degree were 46 percent less likely than respondents with at least one parent with a college degree to report moderate or severe anxiety in law school. Conversely, PPS respondents with at least one parent who did not graduate high school were 29 percent more likely than respondents with at least one parent with a college degree to report moderate or severe anxiety in law school. Interestingly, PPS respondents with at least one parent with some college but no degree were 31 percent less likely than respondents with at least one parent with a college degree to report moderate or severe anxiety in law school.
Among respondents who answered the question, 36 percent reported moderate to severe anxiety, 22 percent reported moderate to severe insomnia, and 20 percent reported moderate to severe depression.
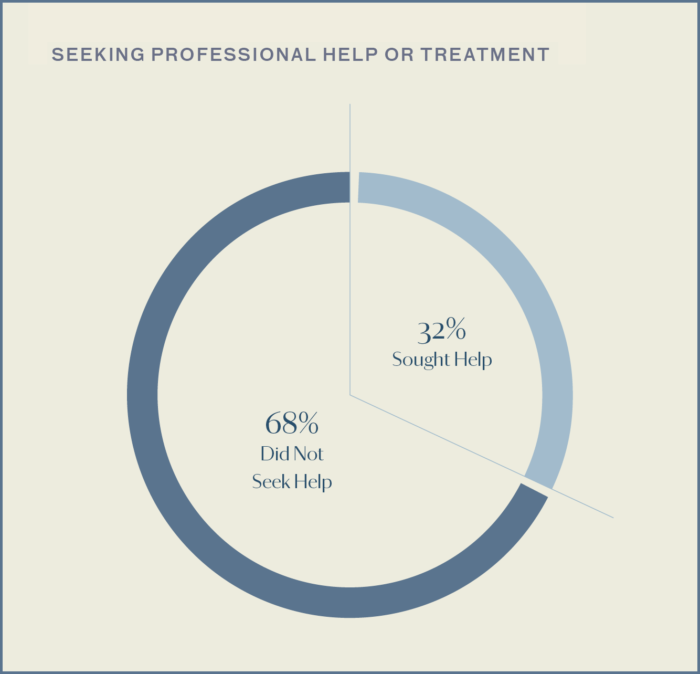
Most PPS respondents who reported serious mental health challenges did not seek help or treatment. Among respondents who reported mild, moderate, or severe panic attacks, alcoholism, drug abuse, or eating disorders, or who reported moderate or severe anxiety, depression, or insomnia, 68 percent did not seek help or treatment. “It didn’t occur to me that I needed to, or should, seek treatment,” reported one respondent. “I thought it was par for the course for lawyers to feel overly stressed, anxious, and un-happy about their work situation.” Women were more likely than men to seek help during their careers.
A Portrait of Asian Americans in the Law
Our study documents the dramatic rise of Asian Americans in the legal profession over the past generation. From the mid-1990s to the mid-2000s, Asian American enrollment in law school grew faster than the enrollment of any other group. Since 2009, however, Asian American enrollment has dropped more precipitously than any other group. This recent decline deserves attention and careful study.
As a variety of indicators show, Asian Americans have a foot in the door in virtually every sector of the legal profession. Now the question is how wide the door will swing open. In earlier times, the influence of Asian Americans in the legal profession was largely constrained by their small numbers. Today, the constraints increasingly have to do with career pathways, incentives, and barriers to promotion. It is possible that age and lack of seniority account for some of the underrepresentation of Asian Americans at the top ranks of the profession. But our study suggests other challenges as well.
The barriers to career advancement facing Asian Americans lawyers are often subtle and not explicit, but they are nonetheless real. One challenge has to do with perceptions. It is striking that across all sectors of the legal profession, Asian Americans report being perceived as hardworking, responsible, logical, and careful, but to a far lesser extent as empathetic, creative, extroverted, and assertive. Whereas Asian Americans are regarded as having the “hard skills” required for lawyerly competence, they are regarded as lacking many important “soft skills.”
A related challenge has to do with our finding that inadequate access to mentors and contacts was the most frequently cited barrier to career advancement among survey respondents. To the extent that mentoring and networking are conditioned by perceptions of sociability and conformity with cultural norms, Asian Americans may face particular obstacles rooted in stereotyped perceptions of being foreign, socially awkward, or unassimilable.
Several of our findings appear consistent with these challenges. Asian American law students are disproportionately enrolled in top-ranked schools, which reflects their strong performance on a key admission criterion, the Law School Admission Test (LSAT).
But Asian Americans do not obtain judicial clerkships in numbers comparable to their enrollment at highly ranked schools, and they are significantly underrepresented in the partner and leadership ranks of law firms. These selection processes—clerkships and law firm promotion—involve not only objective measures of ability, but also access to mentorship and subjective criteria such as likability, gravitas, leadership potential, and other opaque or amorphous factors that may inform whom judges, faculty members, or law firm partners regard as their protégés. Asian Americans appear to face significant obstacles in these settings.
Whereas Asian Americans are regarded as having the “hard skills” required for lawyerly competence, they are regarded as lacking many important “soft skills.”
Another challenge has to do with the gravitation of Asian Americans toward business settings and law firm jobs, and the relative dearth of Asian Americans in various government, nonprofit, and academic settings. The skew toward law firm jobs may account for the higher salaries but also lower career satisfaction and higher frequency of mental health problems observed among Asian American attorneys. It is notable that few Asian Americans appear motivated to pursue law in order to gain a pathway into government or politics. This finding is consistent with the paucity of Asian American lawyers in the highest ranks of government, especially among top prosecutors and judges. Greater penetration into these public leadership roles is critical if the increasing number of Asian American attorneys is to translate into increasing influence of Asian Americans in the legal profession and throughout society. A major challenge is to encourage Asian American lawyers to pursue public service roles and to eliminate barriers for those who do.
Finally, although this study offers a comprehensive portrait of Asian Americans in the legal profession, further data collection and research are needed to deepen our understanding of observed disparities and potential interventions. To what extent is the high associate-to-partner ratio among Asian Americans at major law firms attributable to barriers to advancement versus attractive off-ramps to other opportunities? Is the number of Asian Americans obtaining judicial clerkships more heavily influenced by the hiring decisions of judges or by faculty mentorship and advising? What can be done to position more Asian Americans to serve as judges and top prosecutors? These are among the questions that merit additional research. Going forward, a key challenge is to enhance the portrait we have painted here in broad strokes with more focused and ongoing study of diversity in the legal profession by sector and by state or region. Such study is essential to raising awareness and motivating behavioral and institutional change.
Want to learn more?
For more on the American Bar Foundation’s After the JD project, see the full reports for Wave I, Wave II, and Wave III. For more empirical research on the careers and experiences of black lawyers in the United States, see the Harvard Law School: Report on the State of Black Alumni: 1869-2000 and the Harvard Law School: Report on the State of Black Alumni II 2000-2016.