This article is adapted from the originally published article “The Power Five: The Making of Newsworthy Deal Teams,” found in Vanderbilt Law Review En Banc, volume 77, issue 1, article 6. See the full article for more in-depth analysis, including citations, greater insight into methods, and more.
Women have been more than half of J.D. graduates since 2016 and at least 40 percent of associates since 1997. Today, law firm associates are (slightly) more likely to be women. Yet women account for only about one in four partners, are less likely than men to be equity partners, and are more likely than men to become “staff attorneys” or “counsel.” If partnership is a proxy for power, what does this say about women’s foothold on power in the legal profession?
The takeaway
What do deal teams reveal about the organizational dynamics that affect women’s opportunities and outcomes in the legal profession? Our analysis of over 10,000 deals and more than 50,000 attorneys for the period 2013–2023 reveals evidence that women’s gains may be sustainable even as employers retract DEI interventions. While women are less likely to be at the top of a team and more likely to be on smaller transactions and cases, they are slowly advancing up the team ladder and gaining power. Making the team—the “power five”—reveals existing power structures while also suggesting future authority and control.
In this article, we examine who has “power” in American law firms. Are women advancing to greater decision-making authority and responsibility in a profession where they make up more than half of the labor market entrants? To figure that out, we look at leadership teams on the firm’s principal deals, as defined by the firms themselves.
Publicized deal teams expose the salient power dynamics within law firms. Consider that:
- Deals are the key currency in law firms.
- Deal leaders have the most power within firms. They bring in money and prestige to the firm. Financial and reputational capital in turn determine a lawyer’s influence at the firm.
- Deals are led by a team of lawyers. Every project at an elite firm is run by a leadership team that leverages a larger group of lawyers. For attorneys striving for success in private practice, they must get on the right teams.
- Deal teams have a hierarchy. There will be superiors and subordinates.
- Powerful deal teams are the ones that lead the firm’s big dollar deals.
- Firms decide which deals and deal teams to publicize. Firms issue press releases for only a limited number of matters that they manage. The press releases reflect importance to the firm.
In our conception, winning teams are those the firm deems newsworthy. Making a team reveals an attorney’s relative status and prospects. Leading a team signals preeminence. Thus, the composition of newsworthy deal teams measures status and power within a firm.
To understand whether women are part of the decision-making nucleus at law firms—especially in the wake of DEI program decline—we built a data set of law firm reporting of their most newsworthy deals, the composition of the lawyer teams leading those deals, and the salient characteristics. Are women making those deal teams?
Highlighted findings
We report four key findings from our data, which draws on a sample of over 10,000 significant deals from 2013 to 2023 inclusive, regarding the state of play for gender equity for women lawyers:
- Across the entire 10-year period, women are on 65 percent of deal leadership teams. This reflects an upward trend from 42 percent of teams in 2013 to 78 percent in 2023. The percentage of team members who are women has increased by half from 19 percent in 2013 to 31 percent in 2023.
- Women are less likely than men to be at the top. From 2013 to 2023, one out of every five team leaders is a woman.
- Women work on smaller dollar matters.
- Women are moving up leadership team ladders. Women also are more likely than men to make the team as an associate.
Measuring power in law firms: Designing a deal team data set
What constitutes a deal team and who serves on it?
Making the team
Law practice is teamwork. In every deal, the team structure can be leveraged to understand the dynamics in the legal labor market as well as the provision of legal services. The identity of the person at the top of the deal reveals who has the most power in law firms, which in turn tells us who is influencing major decisions. The identity of other members of the team helps us to identify other power brokers within the firm.
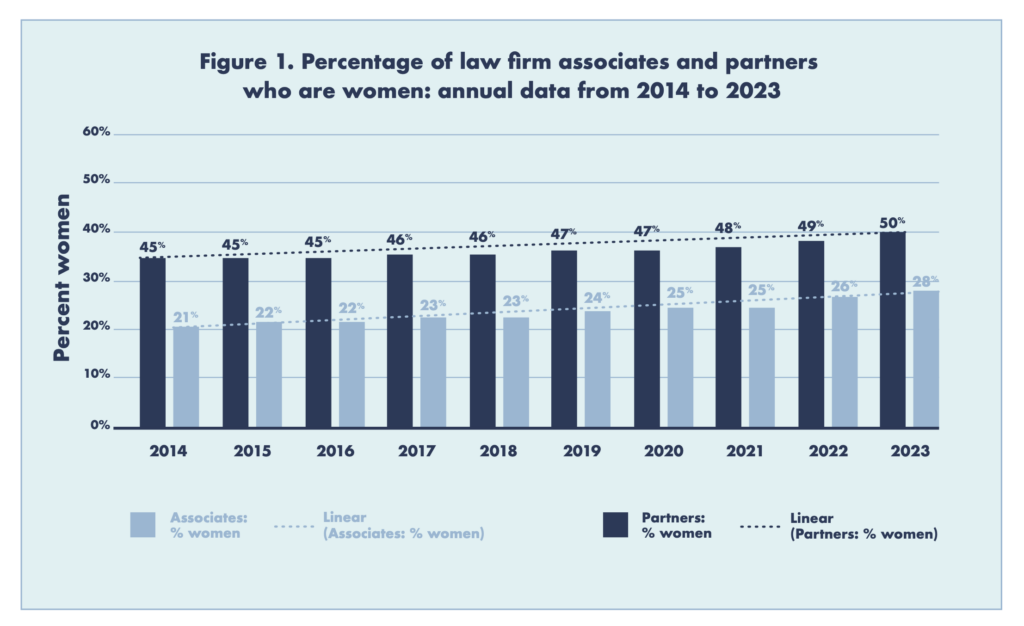
The team’s full membership is key to understanding gender dynamics and to forecasting gender trends. Women have more slowly joined partnership ranks, as reflected in Figure 1, which compares the percentage of associates who are women to the percentage of partners who are women. The rate of growth is similar; however, the relatively low proportion of women partners translates to fewer senior women partners and thus fewer women likely to be at the top of deal teams.
If women are advancing within firms, we might expect to see them making teams at increasing rates over the period and advancing up spots on teams.
That said, more women are senior associates today than a decade ago. Thus, women may be rare at the top spot but more visible in lower spots. If women are advancing within firms, we might expect to see them making teams at increasing rates over the period and advancing up spots on teams. On the other hand, if women are strategically moving into less competitive fields where they can become partners in exchange for less prestige and profile, then they would effectively be “missing” from our data as they won’t make teams the firms deem newsworthy.
Ranking the teams
Firms, for internal and external reasons, have an interest in reporting on significant deals. Elite law firms use bonuses and promotions to incentivize and reward behavior, which in turn depends on valuing the right matters. Our data set includes all deals law firms deem important enough to merit external attention and to recognize internal achievement.
Team rosters
Deal teams are hierarchical. While making a newsworthy deal team distinguishes a lawyer from others at a firm, even on the team, a lawyer is still ranked. Collaborative groups typically have a hierarchy to facilitate function.
Data and analysis
The sample
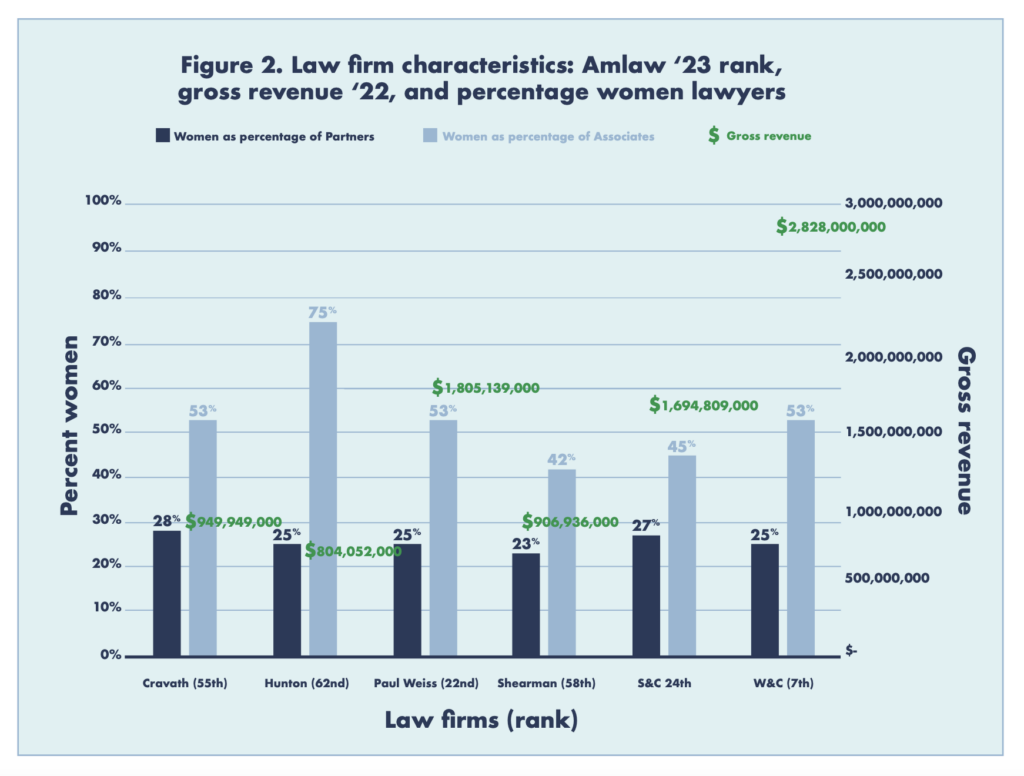
The foundation of the deal team database is the online press releases issued by six law firms: Cravath, Swaine & Moore; Hunton Andrews Kurth; Paul Weiss; Shearman & Sterling; Sullivan & Cromwell; and White & Case.
| Firm | Partners (total) | Percent women partners | Associates (total) | Percent women associates | Gross revenue (2022) | AmLaw 2023 ranking |
| Cravath | 97 | 28% | 299 | 53% | $949,949,000.00 | 55 |
| Hunton Andrews | 303 | 25% | 286 | 75% | $804,052,000.00 | 62 |
| Paul Weiss | 175 | 25% | 654 | 53% | $1,805,139,000.00 | 22 |
| Shearman & Sterling | 191 | 23% | 488 | 42% | $906,936,000.00 | 58 |
| Sullivan & Cromwell | 166 | 27% | 535 | 45% | $1,694,809,000.00 | 24 |
| White & Case | 678 | 25% | 687 | 53% | $2,828,000,000.00 | 7 |
For purposes of the analysis that follows, we can assume these firms to have been randomly selected from the Chambers list of top 100 firms. Some of the firms we initially selected did not report deal team data in a way we could use easily. In those cases, we randomly selected a substitute firm.
The variables
From each press release, we extracted information on the type of the deal, the lawyers who were listed as being on the deal team, and the dollar amount of the deal. Once we had the information on who the lawyers were, we used firm biographies to get additional information.
The richness of the data comes from the lawyer details. The attorneys’ official firm web pages as well as their individual LinkedIn pages provide most biographical variables included in the database. We impute binary gender based on first name relying on proven methods from epidemiology and demographic research. (Current methods do not allow us to identify whether a lawyer identifies as nonbinary.) We also connect law schools to 2023 U.S. News & World Report rankings. Below, we set forth the key variables and the distribution of attorneys across those variables.
Summary statistics
Total lawyer-deal observations: 51,215
Unique deals: 10,0009
- Deal types:
- M&A: 34%
- Capital markets: 41%
- Litigation: 8%
- Pro bono: 2%
- Other: 15%
- Gender:
- Male: 73%
- Female: 27%
- Ethnicity:
- White: 80%
- Asian: 6%
- Black: 2%
- Hispanic: 3%
- Other (including unknown): 9%
- Law school:
- Top 6 law school: 28%
- Top 14 law school: 43%
- Top 50 law school: 55%
- Non-U.S. law school: 26%
Analyzing the data
Women make up 86 percent of newsworthy deal teams. Women hold slightly more than one in four spots on those teams. To assess the gender dynamics closely, we begin by looking at the relative seniority of women on the teams. We then examine the interaction between gender and salient deal variables.
A gender staircase—or slide?
Women make up nearly two out of every three deal teams in our sample. The relative number of women on teams has increased by roughly 50 percent over the past decade: 19 percent of lawyers on teams in 2013 were women compared to 31 percent in 2023.
The average team has five attorneys, whose names are reported hierarchically. We report the first through fourth spots uniquely, and the fifth spot includes any attorney at that level or below. Partners typically dominate the top of the deal. (Lawyer 1, the deal leader, is a partner 83 percent of the time.)
Women’s representation increases as we move down the leadership positions on the team. From 2013 to 2023, women make up 19 percent of the top spot in deals and 23 percent of the second spot, as reflected in Figure 3. Looking at the full leadership team reveals that women are more frequently in spots just below the second spot: 28 percent of lawyers in the third place are women, 30 percent in the fourth, and 32 percent in the fifth and higher.
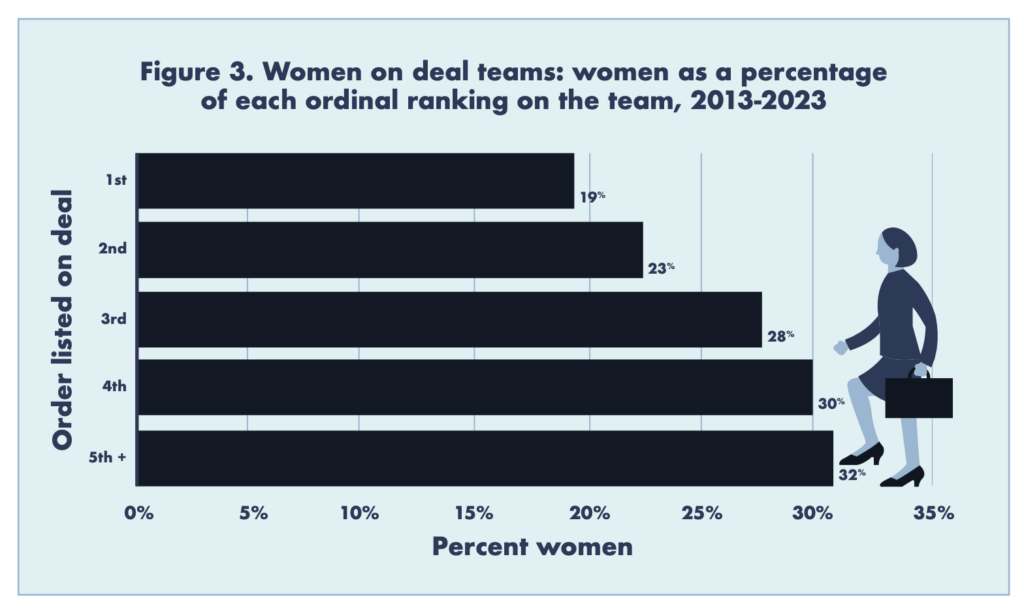
Figure 3 suggests a staircase: women are working their way up to higher spots. Partners dominate the lead spot on deal teams, and senior partners are more likely than new partners to hold that position. The percentage of women partners has more than doubled over the past 30 years but is still only at 28 percent among all law firms’ partners and around 26 percent for the six firms in our study. If partnership is a prerequisite to the top spots, fewer women were eligible during the period of our study.
Lawyers at the top of the deal are also more senior on average. This unsurprising finding makes the number of women in the first position more striking. Women are less likely than men to be senior partners: only 15 percent of partners were women in 2000. Given the number of women who are partners and who are senior, the percentage of women in the top two spots is higher than expected.
We also should consider, however, whether Figure 3 reveals a slide. Women are falling to the bottom of the leadership team and cannot get higher. If this is true, then the women at the top of the deal are the exception. The exceptionalism argument would be supported if the same women repeatedly managed to climb to that top step. Then the graphic would not change meaningfully in another 10 years. In other words, these deals may reflect a superstar effect where the same people keep winning the leadership competition over and over again. To the extent that this superstar effect is disproportionately affecting one gender, progress by women lawyers may be concentrated among a select few.
We do find a superstar effect for the deal leaders for both men and women. This effect seems to operate roughly similarly for men and women, however. For position one, we find that there are 9,987 observations. But for these 9,987 top finishes, there are only 1,447 lawyers occupying these slots. That means that a small fraction of lawyers repeatedly receive most of the goodies. Broken down by gender, 1,087 of that set of first-place occupiers are men and 360 are women. That is, about 25 percent of the top slot occupiers are women. As for the 25 lawyers who appear most frequently, 20 are men and five are women. Thus, exceptionalism does not support the slide hypothesis.
Women increasingly appear on deal teams and are “walking up the staircase” toward the top of the deal.
The slide hypothesis would also be supported if the partners on the lower steps were disproportionately women. Stated differently, women partners would be making the team but hitting a barrier to advancing up the steps in later deals. However, partners sitting in the lower team spots are not more likely to be women. Moreover, women associates are more likely than men to gain a spot on the team: a sign of shifting power within firms.
Men continue to dominate at the top of the deal, in part due to increased gender parity at the firm remaining concentrated at the associate level, with gradual changes at the partnership level. Nevertheless, women increasingly appear on deal teams and are “walking up the staircase” toward the top of the deal. That said, evidence of the winner-take-all phenomenon—where relatively few lawyers lead a disproportionate number of deals—occurs in roughly equal rates for men and women at these firms.
Gender dynamics by deal type and size
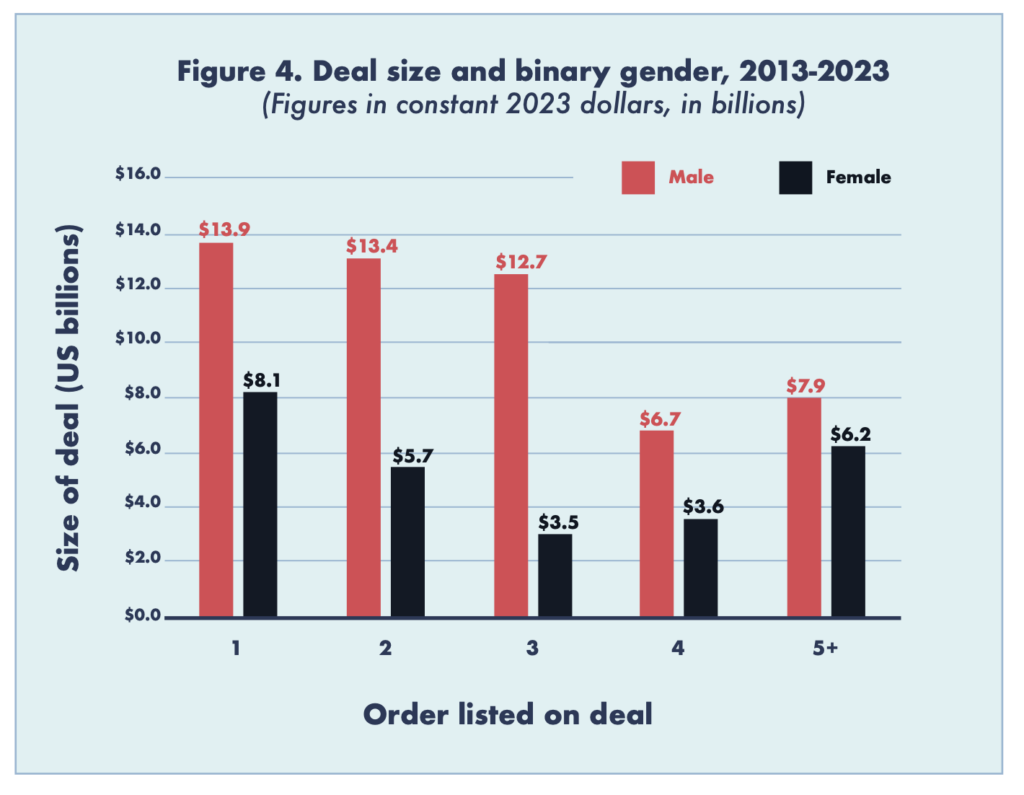
Law firms are for-profit enterprises; thus, leaders who bring in more revenue accrue more power. We cannot observe the firm’s revenue from a deal, such as billable hours. We can, however, observe the size of the deal. This proxy has drawbacks as it ignores other types of value such as prospective and stakeholder value. Yet, the average deal size tells salient features about the work of a deal team.
We look at the average size of deals for women versus men at each step on the deal team ladder in Figure 4. For every one of the power five slots, men are, on average, on bigger deals. If deal size translates into compensation that lawyers ultimately receive, Figure 4 illustrates why women partners are systematically earning less than the men at their firms.
Next, we look at deal type.
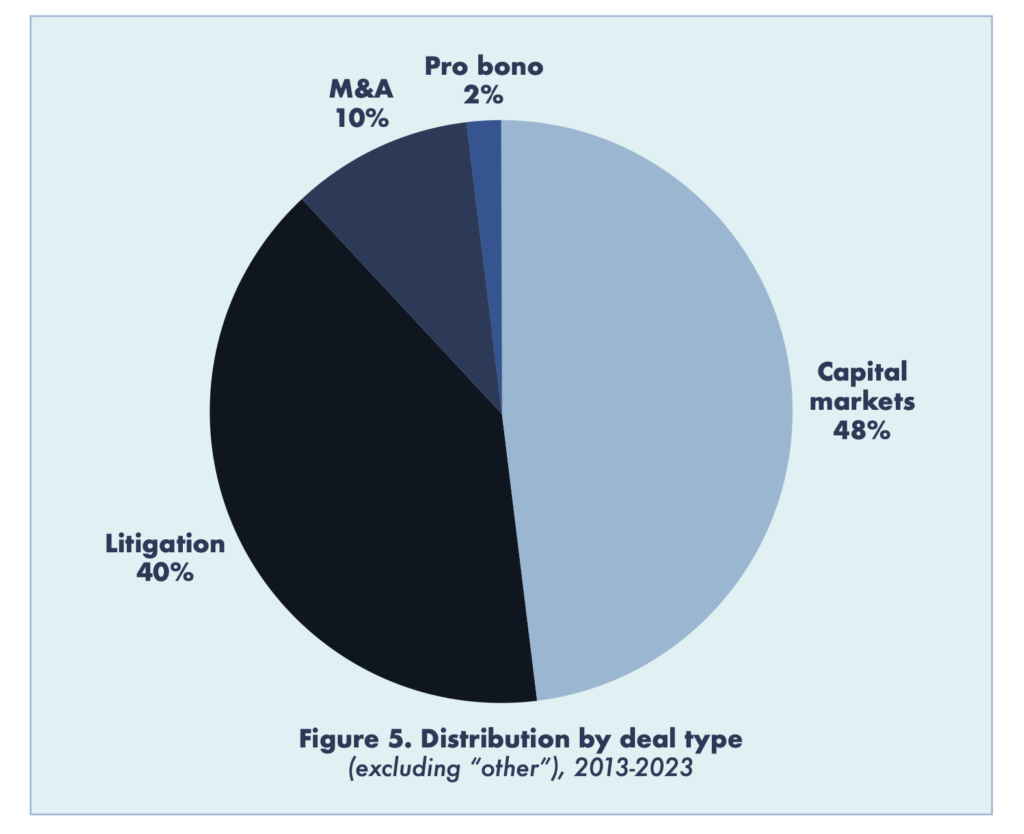
In Figure 5, we see that the law firms in our study chose to advertise two types of deals that account for three-quarters of all deal press releases: capital markets (41 percent) and mergers and acquisitions (M&A) (34 percent). The third most frequently publicized—litigation—is a distant third at 8 percent. Pro bono matters account for 2 percent. (Matters in a catchall “other” category account for 15 percent.)
Women are essentially equally likely to be on newsworthy deal teams in capital markets, M&A, and litigation; however, women are more likely to be on a pro bono team (as compared to their baseline participation rate). Figures 6 and 7 examine how binary gender interacts with deal type. Figure 6 shows the percentage of all team members who are men versus women. For each of the four deal types, men comprise a higher percentage than women on the deal, and these differences across the categories are statistically significant.
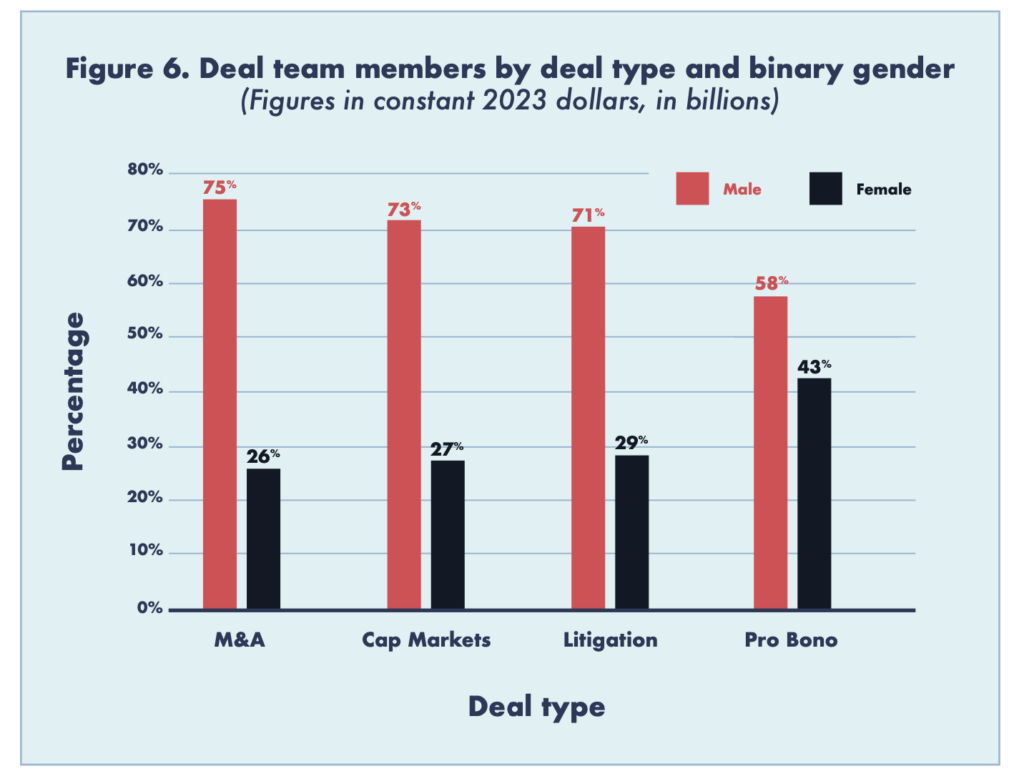
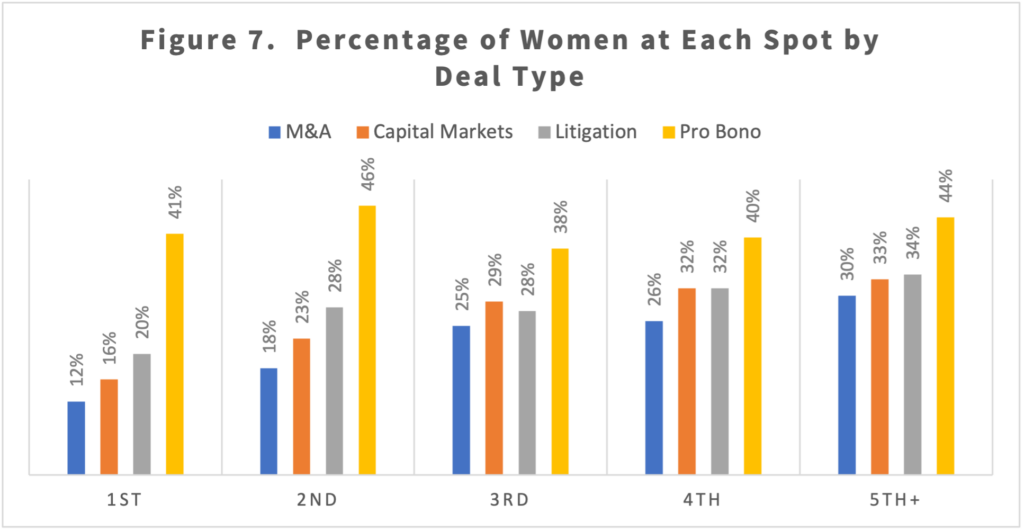
Figure 7 looks at relative position held on the team by men versus women. We find 12 percent of women in the top slot for M&A deals and 16 percent in the top slot for capital markets deals. Putting these numbers together with the fact that men are doing more of the biggest deals (see Figure 4), we can conjecture that the additional women at the top of the deal are coming from smaller transactions that don’t involve public companies. Women, who are more likely than men to be junior partners, may pursue a strategy of leveraging these lower-dollar matters to gain a foothold in the firm’s leadership ranks.
Within M&A, women are present in the third, fourth, and fifth power slots at significantly higher percentages. If the men at the very top of M&A deals are from a generation where there were few women lawyers, then the future should see gender parity gains. And, again, a wise strategy is to look for and capitalize on the opportunity to get into the game by being on the team before expecting to advance to the top of the deal.
If one thinks of M&A and capital markets deals as power centers and pro bono as the least powerful, then women wield less power overall in these firms.
Women are more likely to be in the top or second spot on capital markets transaction teams. This is consistent with a theme that we heard in a prior study focused exclusively on M&A deals. The story from multiple M&A lawyers with whom we spoke was that these deals, and particularly the top spot (with primary client contract), are particularly onerous for women who might have other responsibilities to juggle. In contrast to the 12 percent of women in the top slot for M&A, the fraction is 16 percent in the top capital markets deal slot and 23 percent in the second slot. And when we move to slots 3, 4, and 5+, women are 29 percent, 32 percent, and 33 percent. Those increasing rates of women on deals as one moves down the hierarchy shows a steady growth in women on lawyer teams.
For our last two categories, litigation and pro bono, the percentages of women in every slot are significantly higher than M&A and capital markets. Women are more likely to appear in every one of the top slots for litigation and pro bono than with the first two deal types. Gender dynamics appear different in those two areas and likely for distinct reasons. If one thinks of M&A and capital markets deals as power centers and pro bono as the least powerful, then women wield less power overall in these firms. However, the women are leading pro bono deals that the firm is choosing to publicize.
Gains relative to investment in education
In our prior research, we found that women deal leaders were more likely than men to have graduated from an elite law school. We examined the larger deal data set to see whether the phenomena held true when we looked at a wider array of deals and if we looked to the entire team.
Alumni of the top six (T6) law schools dominate the top of the deal. Roughly one out of three top slots goes to a T6 graduate. Lawyers attending the next range of law schools (T7–T14) occupy a relatively small fraction of the top slots (11 percent). Over a quarter (27 percent) attended the remaining U.S. law schools, and another quarter (25 percent) attended non-U.S. law schools (the remaining 6 percent of lawyers had missing information on law school education).
Women increasingly appear on deals as a whole, but not in the first two spots.
On its face, the foregoing might suggest a status bias in favor of lawyers from the very top schools. But we do not have numbers on the denominator to see where these firms are hiring from. Nor do we have any indicator of lawyer skill so that we can control for differences in skill level.
Moving to gender, Figure 8 shows that for those at the top of the deal (slots 1 and 2), a significantly higher percentage of women attended T6 law schools (31 percent) than men (29 percent). Looking to the next tier of law schools, we see the same pattern: a higher percentage of women attend T7–T14 schools (15 percent) than men (11 percent). Similarly, a higher percentage of women (15 percent) attend the remaining top 50 schools than men (12 percent). For the remaining U.S. schools as well as non-U.S. law schools, a higher percentage of men relative to women graduated from these schools.

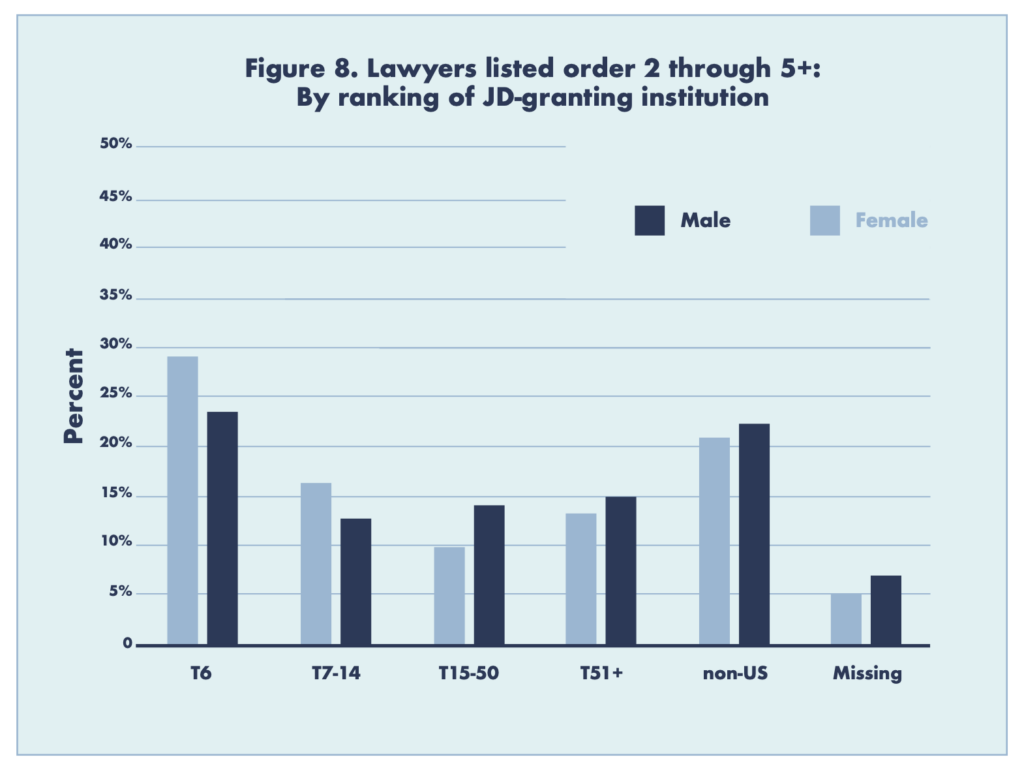
By contrast, for lawyers appearing outside of the top two positions, the opposite pattern emerges. Among men, a higher percentage graduated from a T6 school (30 percent) than did women (23 percent), as well as a T7–T14 school (17 percent for men vs. 12 percent for women). A higher percentage of women attended T15–T 50 schools (10 percent men vs. 14 percent women) and T51+ schools (12 percent men vs. 16 percent women), as well as non-U.S. law schools (26 percent men vs. 27 percent women).
One tentative interpretation from comparing all lawyers versus those at top of the deal is that men appear to have stronger pedigrees across the population. For all deals in our data set we find that a higher percentage of men attend T6 schools (29 percent) than women (25 percent). We also find that a higher percentage of men attend T7–T14 school (15 percent) than women (13 percent). But, as Figure 10 reveals, for those leading or second on the deal, women tend to have stronger pedigrees.
Whether these findings reflect progress for women lawyers depends on the criterion. Women increasingly appear on deals as a whole, but not in the first two spots. Women on these deals increasingly come from a broader range of schools relative to men, but again, not in the top two spots. A causal explanation for this pattern warrants additional study. This differential effect of pedigree could reflect that women face higher levels of discrimination at the top of the deal compared to merely being on the team. It could, however, reflect a time trend where the effect of pedigree is changing, perhaps of less importance for younger lawyers compared to senior lawyers.
Conclusion
The first time an American woman earned a law degree was in 1870. A century later, only 9 percent of law students were women. If that rate of change portended the next century, we would expect to see few women lawyers today. Yet, women law students now outnumber men. A surge of women entering law school in the 1970s and 1980s began the change.
Women are making deal teams at a rate that is commensurate with their rate of partnership.
A similar phenomenon may be happening in private law practice today. The surge of women law students in the 1970s meant a growth in new women lawyers. However, the change in the legal profession was necessarily slow as the new lawyers were just a fraction of the existing profession. When NALP began collecting data on women lawyers in 1991, only 38 percent of law firm associates and 11 percent of partners were women. Those numbers had a strong positive increase year over year through 2023, when more than half of associates and 28 percent of partners are women. (Interestingly, a similar pattern can be seen in law school professors and deans where the representation shows steady growth following the increasing number and seniority of women lawyers and the retirements of the more senior men.) The percentage of women lawyers continues to climb steadily in a sustained way.
Deal leadership shows the same dynamic at play. In our newsworthy deal team data set, we find:
- Women are making deal teams at a rate that is commensurate with their rate of partnership.
- Deal teams are nearly twice as likely to have a woman member today as they were in 2013, moving from 42 percent to 78 percent in 2023.
- Women are at the top of the deal more often than we would predict based on the fact that seniority and partnership are two key determinants of leading a deal team.
- Women who are on deal teams are as likely to be superstars as men.
- Women associates appear to be more likely than male associates to make deal teams.
Junior women attorneys today can readily imagine that they can be firm leaders because they can see women in these positions. (Alternatively, they do not expect their gender will hold them back if they choose that path.) While it is tempting to end on an optimistic note, and the story might indeed be optimistic for gender, we note that the numbers for Black lawyers on deal teams look dismal. But that inquiry is for another day.
Tracey E. George is Vice Provost for Faculty Affairs and Professional Education, Charles B. Cox III and Lucy D. Cox Family Professor of Law and Liberty, and Professor of Political Science at Vanderbilt University. Mitu Gulati is Perre Bowen Professor of Law at the University of Virginia. Albert H. Yoon is Professor and Michael J. Trebilcock Chair in Law and Economics at the University of Toronto.
Cover image: Gajus // shutterstock.