
In this issue of The Practice, one theme rises to the surface over and over again, explicitly and implicitly: the incredible diversity within the Asian American community. In this article, we pause for a moment to elucidate what that means.
As Yung-Yi Diana Pan explains in “Incidental Racialization,” panethnicity in the United States is more a construct that is prescribed than something innate to anyone’s sense of identity independent of how they are perceived. Quoting Pan:
[W]hile sociological research has shown time and again that individuals prefer to assert their ethnic/cultural identities, time spent in the United States results in panethnic/racial identities becoming the preference. Whether asserted or ascribed, arising from disillusion with trying to explain cultural deviances or asserted for strategic activation of identity politics, the end result is panethnic or racial categorization.
In a 2017 write-up by the Pew Research Center, Gustavo López, Neil G. Ruiz, and Eileen Patten run through a list of statistics on the multifaceted nature of the Asian American community. Here are a few highlights that speak to the diversity within this subset of the U.S. population:
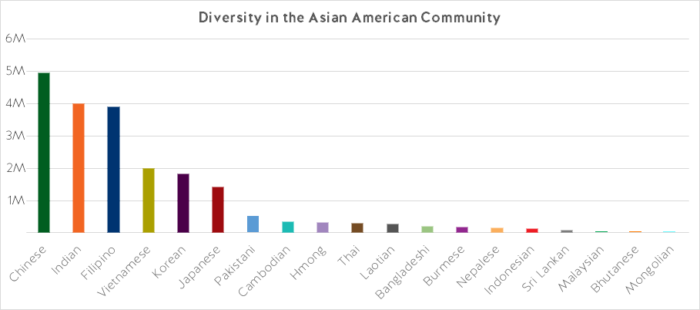
- The Asian American population in the United States, which totaled roughly 20.4 million in 2015, is spread out among numerous countries of origin. Chinese made up the largest group (just under 5 million), with Indian and Filipino coming in at just around 4 million each. It is important to also note that a growing number of individuals identify as multiracial, with more than 1.6 million identifying as Asian and white; nearly 186,000 identifying as Asian and black or African American; and nearly 166,000 identifying as Asian and Native Hawai’ian and Other Pacific Islander.
- Between 2000 and 2015, the Asian American population grew 72 percent (11.9 million to 20.4 million), the fastest growth rate of any major racial or ethnic group. Hispanics, the second-largest growing group, increased 60 percent during the same period.
- Based on this data, 59 percent of Asians in the United States today were born in another country. That figure shifts when one considers specific countries as well as different generations.
- Considered as a group, data suggests that Asian Americans are performing well according to indicators such as income and education. The median annual household income of Asian American–headed households is $73,060 compared to the national median of $53,600. And of Asian Americans ages 25 and older, more than half have a bachelor’s degree or some higher level of education. This, however, is far from the whole story and there is significant diversity within the Asian American community. While Indian Americans earn a median household income of roughly $100,000, Burmese Americans earn a median household income of $36,000. (For more on these income disparities and the model minority myth, see “The Model Minority Myth.”)
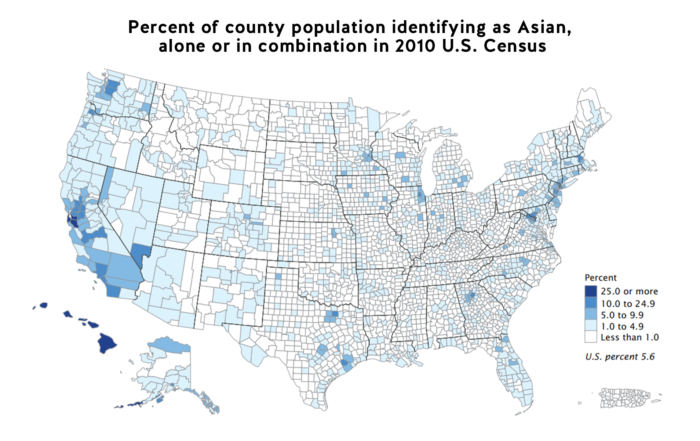
- The plurality of Asian Americans in the United States live in the West (45 percent), while 23 percent live in the South, 20 percent in the Northeast, and 12 percent in the Midwest. Hawai’i is the only majority-Asian state, but there are also significant Asian American populations in California (16 percent), New Jersey (10 percent), Nevada (10 percent), and Washington (10 percent).
According to a 2012 U.S. Census bureau report (using 2010 census data), while multiple-race Asians were more likely to live in either Hawai’i or California, the Asian population grew in every U.S. state between 2000 and 2010. The cities with the largest Asian populations include New York as well as Los Angeles, San Jose, San Francisco, and San Diego in California.
With these population increases comes a diversity of languages. Of the estimated 60 million people in the United States who spoke a language other than English at home in 2011, nearly three million spoke Chinese; more than two million spoke an Indic language (such as Hindi or Urdu); more than one million spoke Korean, Vietnamese, and Tagalog, respectively; and more than two million spoke either Japanese, Cambodian, Hmong, Thai, Laotian, or another Asian or Pacific Island language. Between 1980 and 2010, the numbers of those speaking Chinese and Korean at home has each increased more than 300 percent, while the number of those speaking Vietnamese in that time has increased nearly 600 percent.
Looking at this data, which itself offers only a limited sample of what makes communities and cultures distinct, we are left with a more granular and diverse view of the Asian American community than what a panethnic identity suggests. In “The Model Minority Myth,” we delve deeper into the model minority myth and in particular the increasing income gap within the Asian American community, where stratification is increasing faster than any other racial group. The bottom line is this: “Asian American” encompasses a wide array of geographies, languages, ethnicities, and experiences.